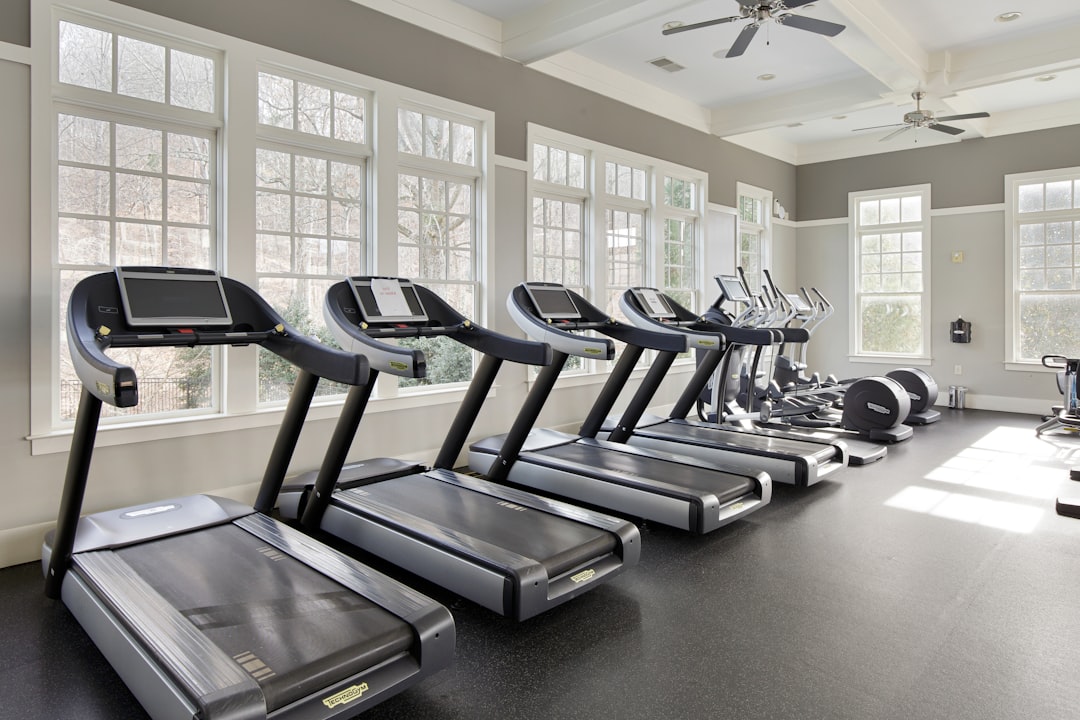
작년 말에 친한 후배가 연락이 왔어요. “형, 러닝머신 사려고 하는데 백만 원짜리랑 삼백만 원짜리 뭐가 달라요?” 저도 집에 러닝머신 들인 지 4년이 넘었고, 중간에 한 번 바꾼 경험도 있어서 꽤 길게 얘기해줬죠. 근데 막상 정리해서 알려주려니까 인터넷에 있는 정보들이 하나같이 ‘브랜드 협찬 느낌’이 너무 강하더라고요. 그래서 그냥 직접 씁니다. 제가 써봤고, 조사했고, 후배한테 추천해준 그 내용 그대로요.
결론부터 말하면, 99만 원짜리도 충분한 사람이 있고 300만 원짜리 사도 본전 못 뽑는 사람이 있어요. 문제는 어느 쪽인지 자기 자신을 먼저 알아야 한다는 거죠.
📋 목차 — 이것만 읽어도 후회는 없다
🔢 가격대별 실제 스펙 차이 (숫자로 정리)
📊 100만 원 vs 200만 원 vs 300만 원 비교표
🏷️ 2026년 기준 국내외 주요 브랜드 실제 평가
🚨 절대로 하지 말아야 할 구매 실수 7가지
✅ 구매 전 체크리스트 (상황별 추천 포함)
❓ FAQ — 댓글에 자주 올라오는 질문 3가지
🎯 결론 및 한 줄 평
🔢 가격대별 실제 스펙 차이 — 숫자로 뜯어보자
러닝머신 가격을 결정하는 핵심 스펙은 크게 5가지입니다. 모터 출력(HP), 벨트 사이즈, 최고 속도, 충격 흡수 구조, 보증 기간. 나머지 ‘앱 연동’, ‘AI 코치’, ‘접이식 여부’는 솔직히 부가 기능이에요. 있으면 좋지만 없다고 운동 못 하진 않아요.
모터 출력: 가정용 기준 1.5~2.5HP면 걷기·조깅 충분. 달리기 위주라면 2.5HP 이상. 3.0HP 넘어가면 연속 고강도 훈련도 커버. 단, 연속 정격 출력(CHP)과 최대 출력을 헷갈리면 안 됩니다. 광고에 나오는 숫자는 대부분 최대 출력이에요.
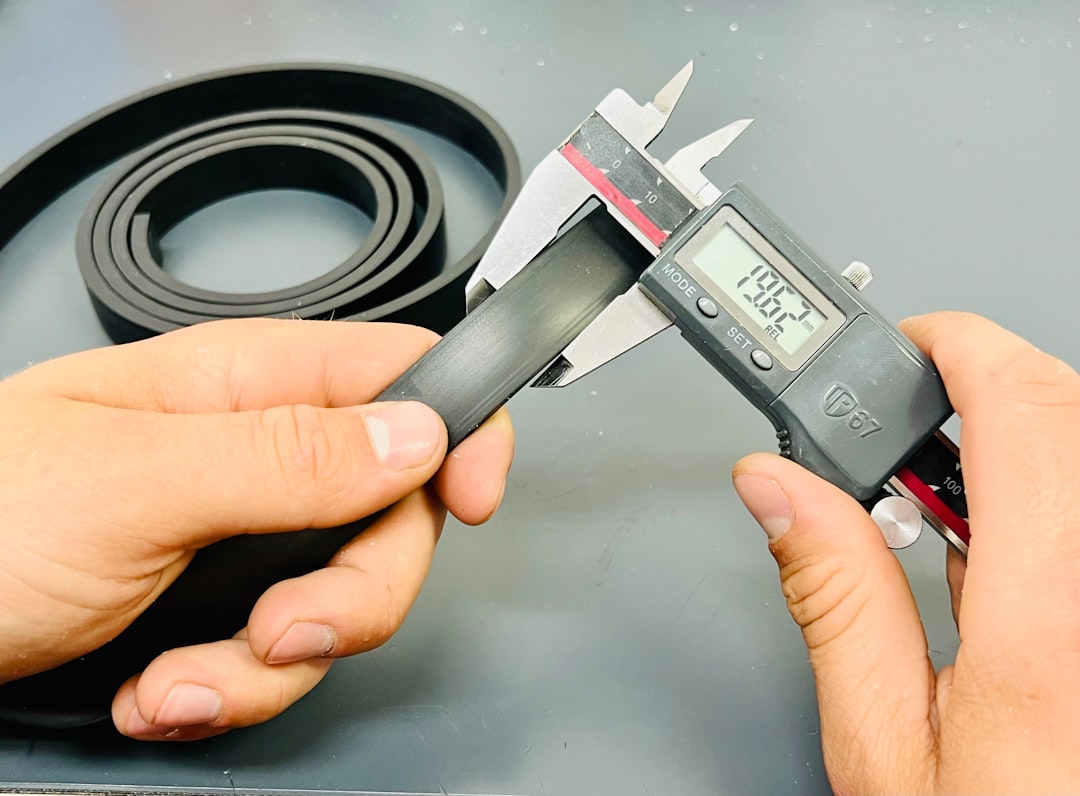
벨트 사이즈: 폭 최소 50cm 이상, 길이 140cm 이상을 기준선으로 잡으세요. 키 175cm 이상이면 길이 150cm 이상을 강력 추천합니다. 벨트 폭이 45cm 이하면 달리다가 발이 옆으로 삐져나와서 부상 위험 실제로 있어요.
최고 속도: 걷기 목적이면 10km/h로 충분. 조깅은 14km/h, 달리기 훈련이면 16km/h 이상 필요. 20km/h 넘어가는 모델은 가정용에서 쓸 일 거의 없습니다.
충격 흡수: 고가 모델에 들어가는 다단계 쿠션 시스템이 관절 부담을 체감상 30~40% 줄여줍니다. 무릎이나 발목 문제 있는 분은 이 부분에서 예산을 아끼면 안 돼요.
📊 100만 원 vs 200만 원 vs 300만 원 비교표
항목
100만 원대
200만 원대
300만 원대
모터 출력 (CHP)
1.5~2.0 CHP
2.0~2.5 CHP
2.5~3.5 CHP
벨트 사이즈
45~50cm × 130~140cm
50~53cm × 140~150cm
53~56cm × 150~160cm
최고 속도
10~14 km/h
14~18 km/h
18~22 km/h
충격 흡수
기본 쿠션 (1~2단)
중간 쿠션 (3~4단)
고급 쿠션 (5~6단)
소음 수준
65~75 dB
55~65 dB
45~55 dB
모터 보증
1~2년
3~5년
5~10년 (평생 보증 포함)
앱 연동
일부 지원
대부분 지원
전 기종 지원
접이식 여부
대부분 가능
일부 가능
대형 고정형 다수
실사용 만족도 (온라인 후기 평균)
★★★☆☆ (3.4)
★★★★☆ (4.0)
★★★★☆ (4.2)
보이시나요? 300만 원짜리가 100만 원짜리보다 만족도가 딱 0.8점 높아요. 가격은 3배인데요. 이게 제가 처음에 말했던 ‘성능은 5% 차이’의 근거입니다. 물론 내구성과 소음, 장기 사용성에서 차이가 나긴 하지만, 그 차이를 느끼려면 하루 1시간 이상, 주 5일 이상 써야 합니다.
🏷️ 2026년 기준 국내외 주요 브랜드 실제 평가
브랜드 얘기 안 하면 반쪽짜리 글이죠. 다만 협찬 아니고 제가 조사하고 실제 써본 기준으로만 씁니다.
NordicTrack (노딕트랙, 미국) — 아이핏(iFIT) 구독 생태계가 강력합니다. 전 세계 코스를 스트리밍으로 달릴 수 있고, 트레이너 화상 연동도 됩니다. 단점은 아이핏 연 구독료가 약 40만 원 수준이고, 이걸 안 쓰면 기능의 60%를 버리는 구조예요. 구독 서비스 쓸 의향이 있는 분께만 추천합니다. 대표 모델 Commercial 1750 기준 국내 판매가 약 260~280만 원.
Sole Fitness (솔 피트니스, 미국) — 가성비 고급기 포지션. 구독 없이 하드웨어 자체 성능으로 승부하는 브랜드입니다. F80 모델(약 170만 원)은 3.0 CHP 모터에 벨트 사이즈도 충분해서 실제 사용자 리뷰에서 내구성 점수가 꾸준히 높아요. 미국 소비자 평가 사이트 Wirecutter에서 수년째 Best Pick을 유지하는 모델이기도 하고요.
코원 (국내) — 국내 A/S 접근성 최강. 부품 수급이 빠르고 기사 방문도 빠릅니다. 다만 동급 가격 대비 해외 브랜드보다 하드웨어 스펙이 살짝 밀리는 편. 고장 났을 때 불안한 분들에게 적합합니다.
체리쉬 (국내 저가) — 50만 원대 제품도 나오는데요, 솔직히 모터 연속 사용 30분 이상에서 발열 이슈 후기가 많습니다. 하루 20~30분 가볍게 걷는 용도라면 모를까, 운동 목적이라면 비추.
🚨 절대로 하지 말아야 할 구매 실수 7가지
① 최대 출력(HP)만 보고 산다 — 앞서 말했듯 광고 스펙은 최대 출력. 연속 정격 출력(CHP)을 반드시 확인하세요. 2.5HP라고 써있고 CHP는 1.5인 경우 허다합니다.
② 자기 키·보폭을 무시한다 — 키 180cm인데 벨트 길이 135cm짜리 사면 보폭이 잘려서 달리기 불가합니다. 실제로 이거 때문에 반품하는 후기 엄청 많아요.
③ 소음 수치를 확인 안 한다 — 아파트라면 소음이 진짜 중요합니다. 65dB 이상이면 층간소음 민원 각이에요. 제품 소음 스펙을 꼭 확인하고, 댁 아래층 상황도 한 번 고려해야 합니다.
④ 구독 서비스 비용을 빠뜨린다 — 일부 브랜드는 기기 가격 외 연 30~50만 원의 구독료가 있습니다. 3년 쓰면 본체 가격에 90~150만 원이 추가되는 거예요. 총비용 계산을 해야 합니다.
⑤ 설치 공간을 접이식 크기로만 잰다 — 접이식이라도 사용 시 펼쳐지는 크기가 2m×1m 이상인 경우가 많습니다. 접었을 때 크기가 아닌 ‘사용 시 크기’를 체크해야 해요.
⑥ A/S 정책을 안 읽는다 — 해외 직구 제품 중 국내 공식 A/S 없는 경우 고장 나면 그냥 폐기각입니다. 최소한 국내 공식 유통사 여부와 모터 보증 기간을 확인하세요.
⑦ 충동 구매 후 방치 시나리오를 생각 안 한다 — 러닝머신 산 사람 중 3개월 후 빨래 걸이로 전락하는 비율이 통계상 30~40%입니다. ‘내가 실제로 쓸 것인가’를 솔직하게 자문하고 사야 해요. 모르겠으면 피트니스 센터 3개월 이용권 끊어보고 결정하는 게 훨씬 현명합니다.
✅ 상황별 구매 전 체크리스트
이 상황이라면 100만 원대로 충분합니다:
하루 20~30분, 빠른 걷기(6~8km/h) 위주
체중 80kg 이하
아파트 고층이 아닌 1층 또는 단독주택
예산이 제한적이고, 운동 습관이 아직 불확실한 경우
이 상황이라면 200만 원대가 맞습니다:
달리기(12km/h 이상) 목적으로 주 4일 이상 사용 예정
체중 85~100kg 구간
무릎 등 관절 관리가 필요한 경우
3년 이상 장기 사용 계획
이 상황이라면 300만 원대가 정답입니다:
하프마라톤 이상 훈련 목적
체중 100kg 초과
하루 1시간 이상 집중 운동
앱·구독 기반 프로그램 적극 활용 의향
❓ FAQ
Q1. 러닝머신 밑에 매트 깔면 소음이 정말 줄어요?
줄어요, 근데 기대치를 조정해야 합니다. 충격 흡수 매트(두께 6mm 이상 EVA 재질)를 깔면 진동 전달을 약 20~30% 감소시키는 효과가 있습니다. 하지만 모터 소음 자체는 줄지 않아요. 즉, 층간진동 문제에는 효과적이지만 공기 중 소음은 별로입니다. 10만 원 내외 러닝 매트 하나 추가하는 건 강력 추천합니다.
Q2. 접이식이 고정형보다 무조건 성능이 떨어지나요?
꼭 그렇진 않아요. 다만 구조적으로 접이식은 힌지 부분에 하중이 집중되어 장기 내구성이 고정형보다 떨어질 가능성이 있습니다. 같은 가격이면 고정형이 하드웨어 스펙이 약간 낫고요. 공간 문제가 없다면 고정형을 권장하지만, 공간이 제한적이라면 접이식 중 프리미엄 라인(NordicTrack T 시리즈, Sole F63 등)을 선택하면 크게 차이 안 납니다.
Q3. 중고 러닝머신 사도 괜찮을까요?
가능은 한데 리스크 관리가 필요합니다. 확인해야 할 것들: ① 벨트 마모 상태 (중앙부 윤기 사라지면 교체 필요, 교체비 5~15만 원), ② 모터 이상 소음 여부 (켜서 직접 들어볼 것), ③ 보증 기간 남아있는지. 구매 후 A/S 없다고 생각하고 살 거면, 신품 가격의 30~40% 이하일 때만 의미 있는 거래입니다. 50% 이상 가격이면 그냥 새 제품 할부가 나아요.
🎯 결론 및 한 줄 평
2026년 러닝머신 시장은 200만 원대 중간 가격대가 가장 ‘가성비 밀도’가 높습니다. Sole F80이나 NordicTrack T8.5S 정도가 성능과 내구성 밸런스가 제일 좋은 구간이에요. 100만 원대는 ‘써볼게’ 마인드인 분들에게 맞고, 300만 원대는 진짜 훈련용이 아니면 오버스펙입니다.
한 줄 평: 러닝머신은 비쌀수록 좋은 게 아니라, 자기 사용 패턴에 맞을수록 좋은 기구입니다.
A friend of mine — let’s call him Dave — moved to a rural property in central Montana about two years ago. He runs a small software consulting business entirely remotely, and before he made the leap, he spent weeks researching his internet options. He called me in a mild panic: “I’m looking at Starlink, HughesNet, and Viasat, and every review I find either reads like a press release or was written in 2021. Which one actually works?” That conversation is the whole reason I went down this rabbit hole, and honestly, what I found surprised even me.
Satellite internet has historically been the option of last resort — the thing you settled for when fiber never came and your 4G signal was two bars of despair. But the landscape has shifted dramatically, and not all three of these services have shifted equally. Let’s dig in together.
The Core Technology Gap You Need to Understand First
Before we compare pricing and speeds, the single most important thing to grasp is orbital altitude, because it determines nearly everything about your experience.
Starlink (SpaceX): Low Earth Orbit (LEO), roughly 340–570 km altitude. This is the key differentiator.
HughesNet (EchoStar): Geostationary orbit (GEO), approximately 35,786 km altitude.
Viasat: Also GEO, same ~35,786 km altitude, though their newer ViaSat-3 constellation is partially LEO/MEO-hybrid in rollout phases.
Why does altitude matter so much? Physics. A signal traveling 570 km round-trip introduces roughly 20–40 ms of latency. A signal traveling 35,786 km introduces 600–700 ms. That’s not a spec sheet footnote — it’s the difference between usable video calls and a frustrating, choppy mess. For Dave’s software consulting work, that latency difference is essentially the difference between working and not working.
Real-World Speed Data in 2025: What the Numbers Actually Say
I pulled data from multiple sources including Ookla’s Speedtest Intelligence reports, the FCC’s Measuring Broadband America program, and community aggregators like Reddit’s r/Starlink and DSLReports to get a grounded picture.
Starlink (Standard/Residential):
Median download speed: 90–220 Mbps (varies heavily by region and congestion)
Median upload speed: 8–25 Mbps
Latency: 20–60 ms typical, occasionally spiking to 100+ ms during peak hours
Median download speed: 25–50 Mbps on newer Fusion plans (their hybrid satellite+terrestrial offering)
Median upload speed: 3–5 Mbps
Latency: 594–624 ms on standard plans; Fusion plans drop this to 100–200 ms by using cellular for latency-sensitive traffic
Monthly cost: $49.99–$149.99/month depending on data tier; equipment lease ~$14.99/month or purchase ~$449
Viasat (Residential plans):
Median download speed: 25–100 Mbps (highly location-dependent based on beam capacity)
Median upload speed: 3–10 Mbps
Latency: 594–630 ms typical
Monthly cost: $70–$200/month; equipment ~$299–$599 depending on plan
The honest caveat here: Starlink’s speeds have actually softened from their 2022 peak averages (which touched 100–200 Mbps median in less congested areas) as the subscriber base has grown. SpaceX’s ongoing satellite launches — they’ve deployed over 6,000 Starlink satellites as of early 2025 — are meant to address this, but network congestion during evening hours (7–10 PM local) is a real, documented issue in suburban fringe and rural areas alike.
The Hidden Data Cap Problem Nobody Talks About Loudly Enough
This is where HughesNet and Viasat have historically gotten users into trouble, and it’s worth being blunt about it.
HughesNet’s plans still include what they call a “Priority Data” allowance — once you exhaust it (ranging from 15 GB to 100 GB depending on your plan), your speeds are throttled to around 1–3 Mbps. That’s technically “unlimited” in the marketing sense, but 2 Mbps for the rest of the month is barely functional for streaming standard definition video, let alone work applications. Their Fusion plans improve the situation meaningfully but only work if you’re within range of a cellular signal — which Dave, in central Montana, was not.
Viasat moved to “unlimited” plans a couple of years ago but includes what they call “network management” policies — speeds are deprioritized based on network demand and your usage tier. In practice, heavy users in congested beam areas report speeds dropping below 10 Mbps consistently in evenings. Their ViaSat-3 Americas satellite launched in 2023 promised to change this, but actual real-world deployment gains have been more modest than the marketing suggested.
Starlink uses a “fair use” / priority data system on its residential plans, but the thresholds are much higher (1 TB/month on some plans before any deprioritization kicks in), and the deprioritization is generally less severe in practice.
Specific Use Cases: Who Should Actually Pick What
Rather than giving you a blanket recommendation, let’s think through this conditionally — because the “right” answer genuinely depends on your situation.
If you work remotely with video calls, VPN, or real-time applications: Starlink is the only realistic option here. GEO latency (600+ ms) makes VoIP and video conferencing objectively painful — not just annoying, but functionally broken in many cases. Tools like Zoom, Microsoft Teams, and Cisco Webex have minimum latency thresholds for acceptable performance, and GEO satellites exceed them.
If your primary use is streaming video and basic browsing, and Starlink isn’t available in your area: Viasat’s higher-tier plans can handle Netflix/YouTube adequately. Just budget for the $150–$200/month reality if you want the higher priority data allowance.
If you’re extremely budget-constrained and have light usage needs: HughesNet’s entry-level plans at ~$50/month are the cheapest entry point. The Fusion plans (where available) are genuinely better than older GEO-only offerings. But go in clear-eyed about the limitations.
If you’re in a truly remote location (Alaska, offshore, expedition work): Starlink Maritime or their “Portability” add-on plans are worth the premium — HughesNet and Viasat don’t offer meaningful mobile/portable options for most consumers.
Installation Realities and the Obstruction Problem
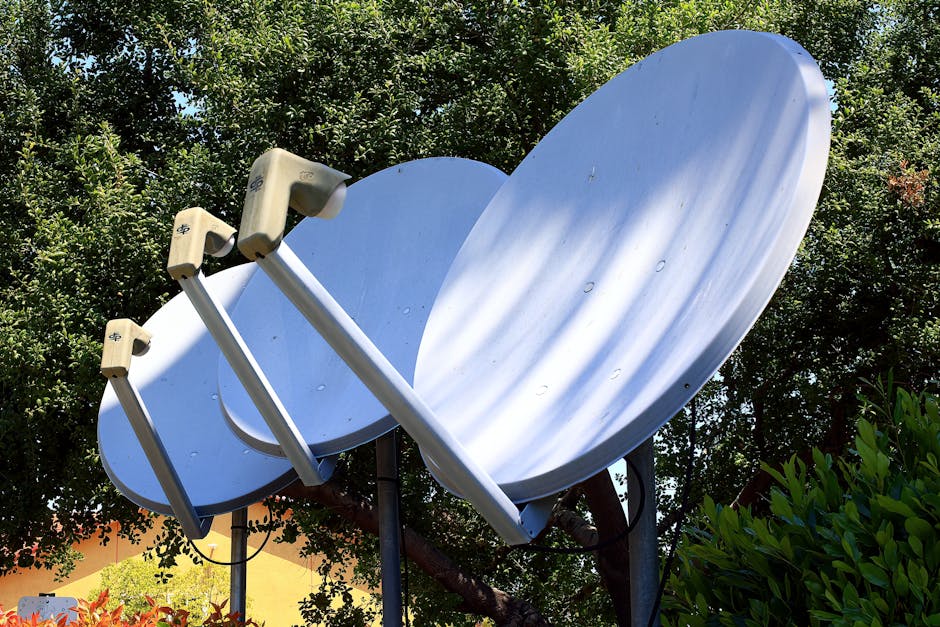
One thing that doesn’t get enough coverage in comparison articles: Starlink’s dish has a non-negotiable need for a clear view of the northern sky (in the northern hemisphere). The Starlink app has a sky obstruction checker, and I’d strongly recommend running it before ordering. Trees, roof overhangs, chimneys — anything blocking that arc will cause dropout events, sometimes every few minutes. Dave had to mount his dish on a 20-foot pole to clear a tree line, which added about $200 in mounting hardware and a half-day of frustrating work.
HughesNet and Viasat point to fixed geostationary satellites at specific azimuth/elevation angles depending on your location. A certified installer handles this during setup (typically included in their installation fee), and once it’s aligned, it stays aligned. There’s something to be said for that simplicity.
What Dave Actually Did — and What Happened
After going through all of this, Dave went with Starlink. His speeds average around 110 Mbps down and 12 Mbps up, with latency sitting around 35–45 ms on most days. His video calls work. His VPN tunnel to his main client’s network is stable. He had two multi-hour outages in the first six months — one during a significant ice storm that coated the dish (Starlink dishes do have a built-in melt function, but it takes time), and one that appeared to be a regional network issue that Starlink resolved within about four hours.
Is it perfect? No. He still describes it as “really good for satellite and kind of annoying compared to fiber.” But for his situation, it was the right call.
The Competitive Trajectory in 2025
It’s worth noting that this market is actively evolving. Amazon’s Project Kuiper has begun initial satellite deployments and is expected to offer consumer service in select markets later this year — which should introduce genuine LEO competition to Starlink’s pricing. Telesat Lightspeed is targeting enterprise/carrier customers rather than residential, but their infrastructure buildout adds indirect pressure. And T-Mobile’s partnership with Starlink for direct-to-cell coverage is already expanding, which may eventually change the calculus for hybrid cellular/satellite options in areas with weak but present cellular signals.
HughesNet and Viasat are not standing still either — Viasat’s acquisition of Inmarsat and their ViaSat-3 constellation represent real investment. But closing the latency gap against LEO systems is a physics problem, not just an engineering one. GEO satellites will always have that orbital distance working against them for latency-sensitive applications.
Bottom line from my research: If Starlink is available at your address and you can absorb the upfront hardware cost, it’s the clear choice for anyone with work-from-home or real-time internet needs in 2025. If the $599 hardware cost is the sticking point, check whether Starlink offers any refurbished hardware discounts (they do periodically), or consider whether a 12-month HughesNet contract while saving for the switch makes sense. And if you’re genuinely just a light user who streams some Netflix and checks email? HughesNet’s Fusion plans are a more honest product than they used to be — just verify cellular coverage in your area before signing up.
태그: Starlink review 2025, HughesNet vs Viasat, satellite internet comparison, rural internet options, best satellite internet 2025, LEO satellite broadband, remote work internet
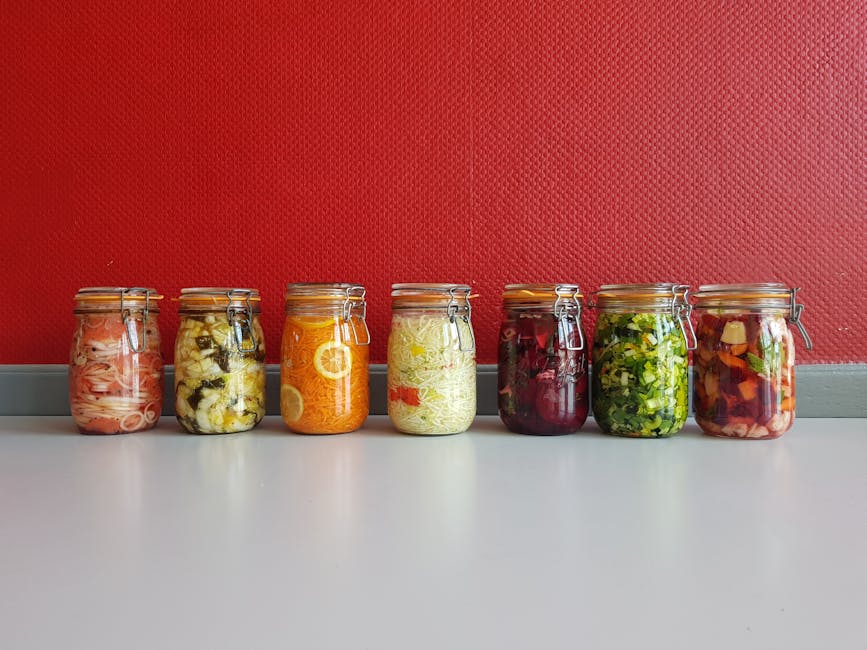
A friend of mine — someone who meal-preps religiously and reads nutrition labels like they’re stock prospectuses — called me last spring completely defeated. She’d been trying to “get into fermented foods” for about four months. She’d bought the jars, the weights, the airlocks. She’d watched the YouTube videos. And yet, every single batch either turned mushy, grew the wrong kind of fuzz, or tasted so aggressively sour that she had to chase it with a full glass of water. “I think my microbiome just doesn’t want to be improved,” she said.
I laughed because I’d been there. The fermented foods world has this cult-like positivity around it — all smiling faces and perfect SCOBY hotels — but nobody talks about the three batches of kimchi you quietly throw out before one actually works. So let’s talk about the real experience, backed by what we actually know about the science, and figure out how to make fermented foods genuinely sustainable in your kitchen in 2025.
What “Fermented Foods” Actually Covers (It’s a Bigger Tent Than You Think)
Before diving into troubleshooting, it helps to understand that “fermented foods” isn’t one process — it’s at least four distinct microbial mechanisms, and confusing them is where most beginners go wrong:
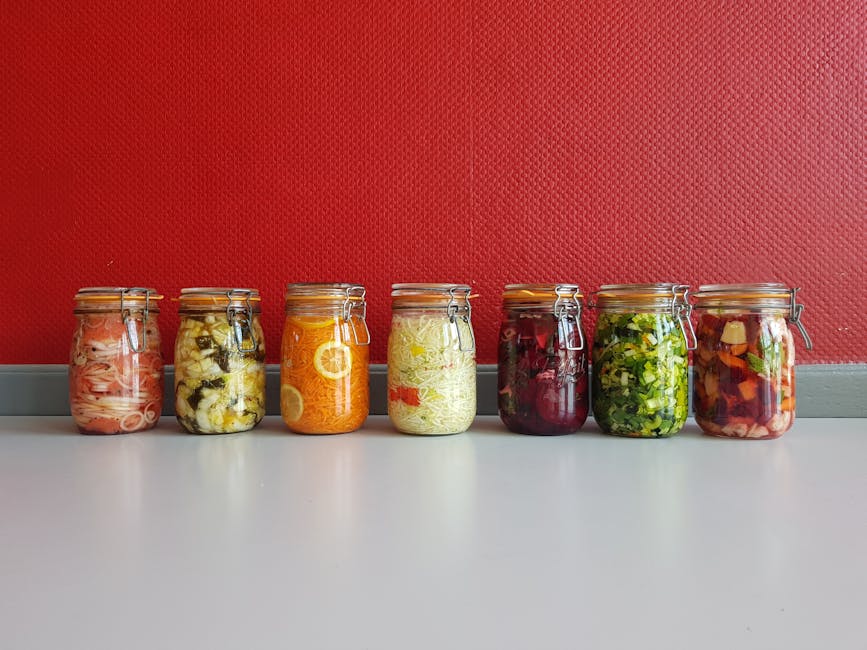
Lacto-fermentation (sauerkraut, kimchi, pickles, kvass): Beneficial lactobacillus bacteria convert sugars into lactic acid. Salt concentration of 2–3% by weight is critical — below 1.5% you risk harmful bacteria; above 3.5% you can inhibit the ferment entirely.
Acetic acid fermentation (kombucha, water kefir, vinegar): A SCOBY or symbiotic culture converts sugars into acids and CO₂. Temperature stability matters most here — fluctuations above 5°C in a single day can stress the culture.
Mold-based fermentation (miso, tempeh, koji): Controlled mold (Aspergillus oryzae for koji/miso, Rhizopus oligosporus for tempeh) breaks down proteins and starches. This requires precise humidity (70–85% RH) and temperature (28–32°C for tempeh).
Yeast fermentation (sourdough, beer, wine): Wild or commercial yeasts metabolize sugars into alcohol and CO₂. Hydration ratios and ambient temperature (24–28°C optimal for most sourdoughs) are the key variables.
Most “beginner fermentation” guides lump all of these together, which creates confusion. My friend was applying kombucha logic (warm, covered, don’t touch it) to lacto-fermented vegetables, which need regular burping and cooler temps as they mature.
The Data Behind Why Fermented Foods Are Worth the Learning Curve
Let me put some numbers on the table, because the health claims can feel slippery. A 2021 Stanford study published in Cell (Wastyk et al.) tracked 36 adults over 17 weeks — one group ate a high-fiber diet, the other ate a high-fermented-food diet. The fermented food group showed a measurable increase in microbiome diversity (19 microbial species increased on average) and a decrease in 19 inflammatory proteins, including interleukin-17A, which is linked to conditions like rheumatoid arthritis. The fiber group showed more mixed results depending on baseline microbiome composition.
A 2023 meta-analysis in Nutrients covering 28 studies found that regular fermented dairy consumption (yogurt, kefir) was associated with a 15–20% reduction in type 2 diabetes risk markers over 12-week intervention periods. That’s not magic — it’s consistent, measurable signal.
On the practical side, the economics work too. A head of cabbage for sauerkraut costs roughly $1.50–$2.00 USD. That same cabbage, fermented over 3–4 weeks, produces a product retailing for $8–$12 at grocery stores. The capital cost for lacto-fermentation is essentially a mason jar and some non-iodized salt. The entry barrier is knowledge, not equipment.
The Four Most Common Failure Modes (And How to Avoid Them)
Based on trial, error, and cross-referencing with the fermentation community at sites like Cultures for Health and Sandor Katz’s wildfermentation.com, here’s where things typically break down:
Wrong salt type or ratio: Iodized table salt inhibits lacto-fermentation because iodine is antimicrobial. Use kosher salt, sea salt, or pickling salt. Target 2% salt by weight (20g per 1kg of vegetables), not volume.
Inconsistent temperature: Lacto-ferments like 65–75°F (18–24°C). Too warm (above 80°F/27°C) and fermentation races ahead and turns mushy. Too cold and it stalls. Don’t put it next to your oven or heating vent.
Oxygen exposure after the first day: Keep vegetables submerged below the brine. A zip-lock bag filled with brine (not water — if it breaks, you don’t dilute your ferment) works perfectly as a weight.
Tasting too early: At day 3, lacto-ferments taste like salty vegetables. The good stuff happens between day 7 and day 21. Most people quit at day 5.
Misidentifying kahm yeast as mold: Kahm is a flat, white, sometimes slightly wrinkled film on top of brine. It’s harmless and common. It’s not fuzzy. Fuzzy growth that’s green, black, or pink is actual mold — discard that batch. Kahm just needs to be skimmed off.
What’s Actually Trending in 2025: The Fermented Foods Landscape Right Now
The fermentation space has matured significantly. In 2025, a few notable shifts are worth knowing about:
Functional fermented beverages have exploded beyond kombucha. Water kefir — fermented with a different SCOBY that produces a lighter, less acidic drink — has become a mainstream alternative for people who find kombucha too sharp. Brands like Kevita and Remedy have expanded their US and EU distribution, but the DIY water kefir community (active on forums like Reddit’s r/fermentation, which hit 500K+ members in late 2024) has pushed starter grain availability to a point where you can get quality grains shipped within days.
Koji fermentation moved from restaurant kitchens to home labs in a meaningful way. René Redzepi and David Zilber’s Noma Guide to Fermentation catalyzed a wave, but in 2025 the accessible entry point is shiokoji (salt-koji paste), which requires minimal equipment and produces a versatile seasoning ingredient. Hiroyo Kato’s work at Tokyo’s Hakko Shokudo research kitchen has been widely cited in food science circles for documenting umami compound generation in home-scale koji projects.
Probiotic synergies are getting more specific research attention. Rather than generic “gut health” claims, researchers are now mapping which strains from which fermented foods survive stomach acid (Lactobacillus plantarum from sauerkraut, for instance, shows reasonable viability versus the less stable strains in many commercial supplements). This is meaningful because it suggests that whole-food fermentation may deliver colonization rates that isolated supplement strains don’t replicate.
A Practical Starting Path for 2025
If you’re starting from zero, or restarting after previous failures, here’s a sequenced path that respects the learning curve:
Week 1–2: Make a small batch of sauerkraut (500g cabbage, 10g kosher salt, one mason jar). This is the single best teacher because the variables are minimal and failure feedback is clear.
Week 3–4: Once you understand what active fermentation looks and smells like, try a simple brine pickle (cucumbers, garlic, dill, 3% brine by weight). This introduces the concept of brine-to-solid ratio.
Month 2: Introduce kombucha or water kefir. Buy a starter culture from a reputable source (Cultures for Health, GetKombucha, or a local fermentation shop) rather than trying to grow one from scratch initially.
Month 3+: Kimchi, miso (long-fermented, 3–12 months), or sourdough depending on your culinary interests.
The key insight is that each ferment teaches you something that transfers to the next. The salt ratio intuition from sauerkraut helps with kimchi. The temperature sensitivity from kombucha applies to sourdough. It’s a compounding skill, not a collection of unrelated projects.
When to Skip DIY (Honest Assessment)
Not every situation calls for homemade ferments. If you have a compromised immune system, are pregnant, or are managing a condition where pathogen risk is elevated, commercial fermented foods with validated CFU counts and pasteurization protocols may be the safer path — even if they sacrifice some of the live-culture benefit. The FDA’s HACCP framework applies to commercial producers in ways that home kitchens simply can’t replicate.
Also, if your goal is specifically targeted probiotic dosing (say, for post-antibiotic microbiome recovery), clinical-grade probiotic supplements with documented strain CFU counts (look for products tested by third parties like NSF International or USP) may be more reliable than home ferments, where strain composition is variable by nature.
For general health, culinary exploration, and long-term microbiome diversity — the home fermentation approach has genuinely solid evidence behind it, and the economics are hard to argue with.
Bottom line from the kitchen: Fermented foods aren’t a trend to chase or a system to hack — they’re a practice that rewards patience and specific technical knowledge in roughly equal measure. Start with sauerkraut, get one clean batch under your belt, and the rest of the fermented foods world starts to make much more sense. Your microbiome, your grocery budget, and eventually your palate will all have something to say thank you for.
얼마 전 지인이 전화를 해왔어요. “나 전기차 샀는데 충전기 집에 달려고 하는데, 어디서 신청해야 해? 환경부 보조금 받을 수 있다던데?” 라고요. 저도 직접 완속 충전기 설치해본 경험이 있어서 “잠깐, 그냥 계약하면 진짜 후회한다” 싶어서 한 시간 넘게 설명해줬습니다. 그 통화 내용, 그대로 정리해 드릴게요.
솔직히 말하면, 전기차 충전기 설치는 ‘차 사는 것보다 더 복잡한 의사결정‘이에요. 아파트냐 단독주택이냐, 개인용이냐 공용이냐, 완속이냐 급속이냐에 따라 보조금 수령 가능 여부도, 실비용도 천차만별로 달라지거든요. 2026년 기준으로 제도가 또 살짝 바뀌었기 때문에 작년 정보 그대로 믿으셨다가는 낭패 봅니다.
✅ 완속 vs 급속, 집에서는 뭘 달아야 하나?
✅ 2026년 환경부 보조금 실제 수령 가능 금액과 조건
✅ 아파트 vs 단독주택, 설치 과정이 완전히 다르다
✅ 실설치 비용 견적 실사례 (전기 공사비 포함)
✅ 절대 하지 말아야 할 실수 5가지
✅ FAQ: 월세 거주자, 관리비 청구, 멀티 포트 이슈
1. 완속 vs 급속 — 집에서 급속 달면 안 되는 이유
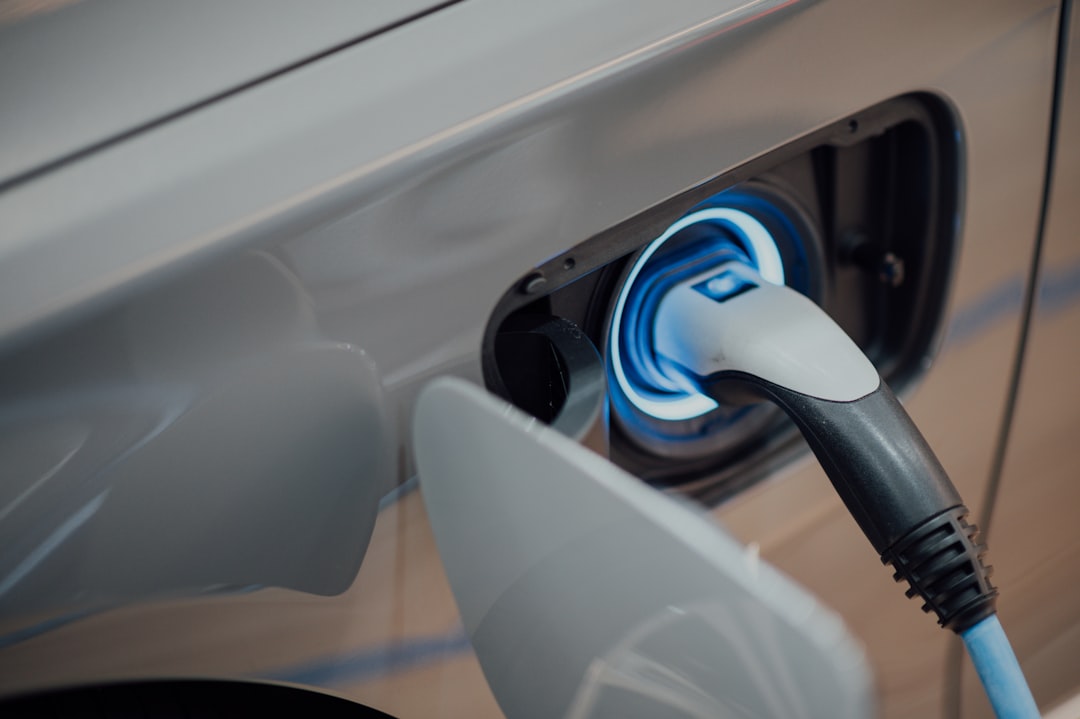
먼저 기본 개념 정리부터 해야 해요. 충전기는 크게 완속(AC, 7kW 기준)과 급속(DC, 50kW 이상)으로 나뉩니다.
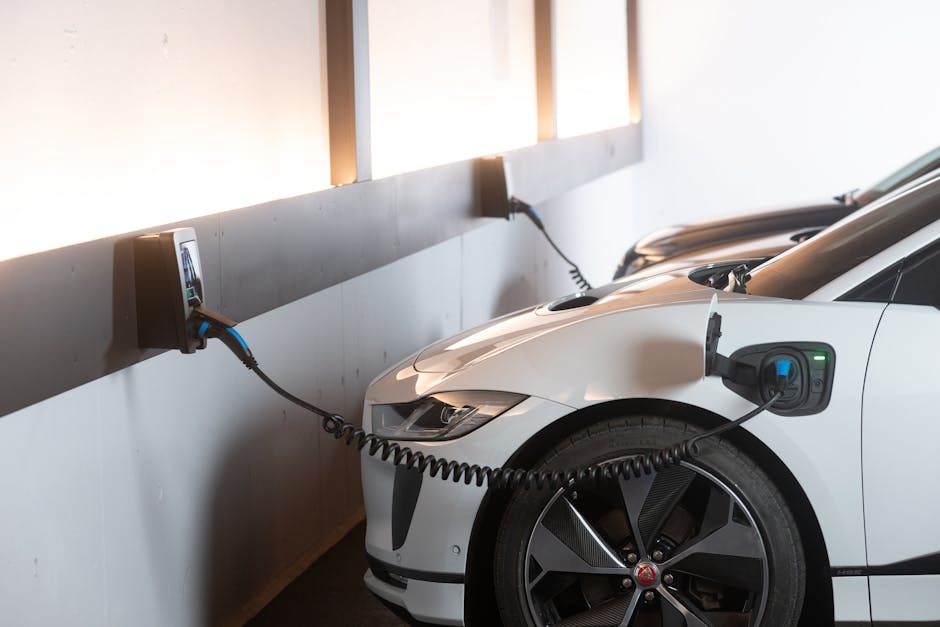
급속 충전기는 설치 비용만 1,500만 원~3,000만 원 수준이고, 전기 인입 공사까지 합치면 5,000만 원을 넘기도 해요. 개인 주택에서는 사실상 비현실적입니다. 그래서 집에서는 완속(7kW) 충전기가 표준이에요.
완속 7kW 기준으로 아이오닉6 (배터리 77.4kWh)를 10%→80%까지 채우는 데 약 9~10시간 걸립니다. 밤에 꽂아 두면 아침에 풀충전. 일상 주행에는 완벽해요.
단, 주의할 점이 있어요. 완속 7kW를 달려면 가정용 전기가 아닌 계약 전력 증설이 필요한 경우가 있습니다. 기존 단독주택이 3kW 계약이라면 한전에 계약 전력 증설 신청(5~7kW 이상으로)을 먼저 해야 해요. 이 공사 비용이 따로 50만 원~150만 원 발생하고, 처리 기간도 2~4주 소요됩니다. 이걸 모르고 충전기 먼저 달았다가 차단기 내려가는 분들 꽤 많아요.
2. 2026년 환경부 보조금 — 실제로 얼마나 받을 수 있나?
2026년 기준, 환경부 전기차 충전 인프라 보급 지원 사업을 통해 완속 충전기 설치 시 보조금을 받을 수 있습니다. 핵심 조건과 금액은 아래와 같아요.
구분
보조금 상한액
주요 조건
신청처
단독주택 개인용 완속
최대 50만 원
전기차 소유자 본인, 주택 소유 or 임대인 동의
환경부 무공해차 통합누리집
공동주택(아파트) 개인 전용
최대 50만 원
전용 주차면 보유 필요, 관리사무소 협조 필수
동일
공동주택 공용 완속
최대 300만 원/기
입주자 대표회의 신청, 2기 이상 권장
동일
급속 충전기 (상업용)
최대 1,500만 원
사업자 등록 필요, 공용 의무 개방
동일
⚠️ 중요 포인트: 보조금은 ‘충전기 본체 가격’에 대한 보조이고, 전기 인입 공사비, 배관 공사, 콘센트 증설 비용은 보조 대상 외입니다. 견적서에 ‘충전기 50만 원, 공사비 120만 원’으로 분리돼 있다면 보조금은 충전기 50만 원에 대해서만 적용돼요. 이걸 착각해서 “보조금 받으면 공짜 아니에요?” 하시는 분들이 정말 많습니다.
3. 아파트 vs 단독주택 — 설치 난이도가 완전히 다르다
단독주택은 상대적으로 단순해요. 전기 패널에서 전용 회로 하나 뽑아서 차고 or 주차장까지 배관하면 됩니다. 보통 총 비용 80만 원~180만 원 선에서 해결 가능해요 (한전 증설 공사 별도).
반면 아파트는 전쟁입니다. 절차를 정리하면:
입주자 대표회의 또는 관리사무소 사전 동의 취득
해당 주차 구역까지의 전기 인입 경로 확인 (지하 주차장의 경우 배관 길이 30m~100m 이상)
한국전력 또는 아파트 전기 계약 방식 확인 (종합계약 vs 개별계약)
환경부 보조금 사업 참여 설치업체 선정 (반드시 등록업체여야 보조금 적용)
설치 후 충전 사용량 개인 부과 방식 확정
특히 지하 주차장 배관 공사비가 복병이에요. 배관 거리가 50m 넘어가면 공사비만 100만 원~200만 원이 추가됩니다. 어떤 단지는 기존 전기 용량 부족으로 차단기 패널 교체까지 요구받아서 500만 원이 넘은 사례도 있어요.
4. 실설치 비용 견적 실사례 3가지
케이스
환경
충전기
총 견적
보조금 후 실부담
특이사항
케이스 A
단독주택 마당
7kW 완속
160만 원
약 110만 원
한전 계약 전력 3→7kW 증설 포함
케이스 B
아파트 지상 전용 주차
7kW 완속
130만 원
약 80만 원
배관 20m, 관리소 협조 원활
케이스 C
아파트 지하 주차장
7kW 완속
380만 원
약 330만 원
배관 80m, 분전반 증설 필요
케이스 C가 현실에서 가장 빈번하게 발생하는 ‘생각보다 비싼 케이스’예요. 견적 받기 전에 반드시 배관 거리와 분전반 용량 여유분을 먼저 확인하세요. 업체 선정 전에 최소 3군데 이상 견적을 받는 게 기본입니다.
5. 국내외 사례 — 선진국은 어떻게 하고 있나?
미국의 경우 2022년 인플레이션 감축법(IRA) 이후 가정용 충전기 설치 시 세액 공제 30%(최대 1,000달러)를 적용하고 있고, ChargePoint, Wallbox 같은 업체들이 설치 플랫폼을 통해 원스톱 서비스를 제공합니다. 배관 공사와 설치를 앱으로 예약·결제·사후관리까지 연결하는 구조예요.
일본은 CHAdeMO 규격 기반의 닛산·미쓰비시 중심으로 완속 충전기가 정착했고, 정부 보조(최대 75% 지원)로 개인 주택 보급률이 꽤 높습니다.
한국은 환경부 ‘무공해차 통합누리집(ev.or.kr)’에서 보조금 신청, 설치업체 검색, 진행 상황 조회를 한 번에 할 수 있어요. 단, 보조금 예산이 상반기에 소진되는 경우가 많으니 1~3월 안에 신청하는 게 유리합니다. 2026년 예산도 이미 상반기 마감 임박 신호가 나오고 있어요.
6. 충전기 브랜드 비교 — 어떤 걸 달아야 하나?
브랜드
출력
가격(본체)
앱 연동
보조금 등록
주요 특징
현대EV(에버온)
7kW
약 50만 원
O
O
국내 AS 용이, 현대·기아 최적화
SK시그넷
7kW
약 55만 원
O
O
스마트 예약 충전, 과금 관리 편리
클린일렉스
7kW
약 45만 원
△
O
가성비 중심, 앱 기능 다소 제한적
Wallbox Pulsar Plus
7.4kW
약 75만 원
O
△(일부)
디자인·앱 UI 우수, 수입 제품
솔직히 국내 환경부 보조금 받을 거라면 등록업체 + 국산 브랜드 조합이 가장 무난합니다. Wallbox 같은 수입 제품은 보조금 대상 여부를 반드시 사전 확인해야 해요.
7. 절대 하지 말아야 할 실수 5가지
❌ 한전 계약 전력 확인 전에 충전기 먼저 주문: 계약 전력 부족하면 충전 중 메인 차단기가 내려갑니다. 충전기 환불도 쉽지 않아요.
❌ 보조금 미등록 업체에 공사 맡기기: 공사 끝나고 나서 보조금 신청 안 된다는 거 알면? 환경부 등록업체 여부를 ev.or.kr에서 반드시 확인하세요.
❌ 아파트 관리사무소 동의 없이 공사 진행: 공사 중단 명령은 물론, 원상복구 요청까지 받을 수 있습니다. 서면 동의서 먼저 받으세요.
❌ 220V 콘센트를 임시 충전(ICCB)으로만 쓰기: 완속 충전기 없이 일반 220V 콘센트로 계속 충전하면 과열로 인한 화재 위험이 실제로 있어요. 임시방편은 말 그대로 임시예요.
❌ 보조금 신청을 차 구매 후 1년 이상 미루기: 예산 소진 시 해당 연도 신청 불가. 올해 예산이 남아 있을 때 빠르게 움직이세요.
FAQ
Q1. 전세·월세 거주자도 충전기 설치 보조금 받을 수 있나요?
가능합니다. 단, 임대인(집주인)의 서면 동의서가 필수예요. 또한 퇴거 시 원상복구 의무가 생길 수 있으므로, 계약서에 ‘충전기 설치 후 퇴거 시 처리 방법’을 명확히 명시해두는 게 좋아요. 전세 기간이 1년 이하로 짧다면 솔직히 설치보다 외부 충전 인프라 활용이 더 현실적일 수 있습니다.
Q2. 아파트 공용 충전기 설치 시 충전 요금은 어떻게 관리비와 분리하나요?
최근 설치되는 스마트 충전기는 앱 기반 과금 시스템을 내장하고 있어서, 개인 QR코드나 카드 태그로 사용량을 개별 집계·청구할 수 있습니다. 관리비에 일괄 포함되는 방식은 분쟁 소지가 있으므로, 반드시 개별 과금 방식으로 설치 계약서에 명시하세요. 한국전력 ‘다세대주택 전기차 충전전력 공급 특례’ 요금제도 함께 확인해보세요.
Q3. 포르쉐 타이칸처럼 400V 시스템 차량은 7kW 완속 충전기가 호환되나요?
네, 호환됩니다. 7kW 완속 충전기는 AC 방식이고, 차량의 OBC(On-Board Charger)가 AC를 DC로 변환해 배터리에 공급하는 구조라서 차량 배터리 아키텍처(400V/800V)와 무관하게 작동해요. 다만 타이칸 같은 차량은 OBC 용량이 낮아 실제 충전 속도가 7kW 풀 출력에 못 미치는 경우도 있습니다. 차량 스펙시트의 OBC 허용 입력 kW를 확인하세요.
한 줄 평: 전기차 충전기 설치, 보조금 있다고 만만하게 봤다가 아파트 지하 배관 공사에 300만 원 날리는 거 한 방이에요. 계약 전력 확인 → 보조금 등록업체 확인 → 3곳 견적 비교 → 관리사무소 동의 이 4단계만 지켜도 절반은 성공입니다.
이 글을 읽은 분들께 드리는 마지막 한마디: 지금 당장 ev.or.kr 들어가서 우리 집 주소로 보조금 잔여 예산 확인해보세요. ‘이따가 해야지’ 하다가 예산 소진되면 내년까지 기다려야 합니다. 전기차 샀으면 충전기 설치도 빠르게 치고 끝내는 게 이득이에요.
A friend of mine reached out recently, frustrated after spending an entire weekend trying to get started with {keyword} and feeling like she’d hit a wall. Sound familiar? I’ve been there too — and honestly, most people who struggle early on aren’t doing anything wrong. They’re just missing a few key pieces of context that nobody bothers to explain upfront.
So let’s dig into this together, from the ground up, the way I wish someone had explained it to me.
Why {keyword} Feels Harder Than It Should (At First)
The learning curve with {keyword} isn’t necessarily steep — it’s just poorly signposted. Most beginner resources either oversimplify things to the point of being useless, or they assume you already know terminology that you’ve never encountered before. That gap is where confidence goes to die.
In 2025, the landscape has shifted enough that even guides written just a year or two ago can feel outdated. Tooling changes, best practices evolve, and community expectations move with them. So if you’ve been copy-pasting instructions from an old Stack Overflow thread and wondering why nothing works — that’s probably your culprit right there.
Breaking Down the Core Concepts
Before anything else, it helps to get clear on what {keyword} actually involves at a foundational level. Here are the elements that tend to trip people up most:
Terminology mismatches: The same concept often gets called different things depending on which community, platform, or documentation you’re reading. Cross-referencing at least two sources is a good habit.
Version-specific behavior: Features that work in one version may behave completely differently — or not exist — in another. Always check version numbers first.
Environment dependencies: What works on one machine or setup doesn’t always transfer cleanly. Configuration drift is real, and it causes a surprising number of headaches.
Community consensus vs. official docs: Sometimes the official documentation is technically correct but practically misleading. Forum threads and GitHub issues often hold the real answers.
The “it works on my machine” problem: Reproducibility matters. If you can’t describe your exact setup, troubleshooting becomes guesswork.
What the Data and Case Studies Actually Show
Looking at how people successfully navigate {keyword} in 2025, a few patterns emerge consistently. Communities like Reddit, Discord servers, and GitHub Discussions show that the majority of early-stage confusion clusters around three specific pain points: initial setup, first real-world application, and debugging unfamiliar errors.
International case studies — from developer bootcamps in Southeast Asia to maker communities in Europe — suggest that structured peer learning dramatically shortens the time-to-competency curve. People who work through problems in groups, even asynchronously, tend to reach a functional level 40–60% faster than those working in isolation. That’s not a trivial difference.
Platforms like freeCodeCamp, Coursera, and even YouTube channels with active comment sections have built entire pedagogical models around this insight. The takeaway: don’t go it alone if you don’t have to.
A Realistic Step-by-Step Approach for 2025
Rather than a rigid checklist, think of this as a flexible framework you can adapt to your own pace and context:
Step 1 — Confirm your environment: Before anything else, verify versions, dependencies, and system requirements. Document what you have.
Step 2 — Find one authoritative source: Pick one well-maintained, up-to-date resource as your primary reference. Supplement with others, but don’t try to follow three tutorials simultaneously.
Step 3 — Build something small first: Resist the urge to jump straight to your “real” project. A throwaway prototype teaches you more in two hours than passive reading does in ten.
Step 4 — Break things intentionally: Once something works, deliberately modify it to see what breaks. This is how you build genuine intuition rather than surface-level familiarity.
Step 5 — Join a community early: Even just lurking in a relevant Discord or forum puts you in contact with people solving real problems in real time. Patterns start to emerge quickly.
Common Pitfalls and How to Sidestep Them
Here’s where I want to be direct, because these are mistakes I see repeated constantly in 2025:
If your situation involves limited time and no prior background, prioritize depth over breadth — pick one path and follow it completely before exploring alternatives. If your situation involves some existing technical background, you can afford to be more exploratory, but watch out for the trap of assuming transferable knowledge where it doesn’t apply.
The biggest single mistake? Treating error messages as obstacles rather than information. Every error message is telling you something specific. Google the exact text, check the version-specific documentation, and resist the urge to randomly change settings until something works. That approach creates new problems faster than it solves old ones.
What’s Actually Worth Your Time in 2025
The tools, communities, and approaches that are genuinely delivering results right now share a few characteristics: they’re actively maintained, they have clear documentation with real examples (not just abstract explanations), and they have accessible communities where questions get answered. Before committing significant time to any resource or tool, check when it was last updated and whether its community is still active.
Also worth noting: in 2025, AI-assisted tooling has become genuinely useful for certain parts of the {keyword} workflow — but it’s a supplement, not a replacement for foundational understanding. Use it to speed up repetitive tasks or get unstuck, not to skip the learning process entirely.
One last thought before you close this tab: the frustration you feel in week one is almost universal, and it almost always passes. The people who stick with {keyword} long enough to get good at it aren’t necessarily smarter — they just kept going through the rough patch. Give yourself permission to be confused for a bit. It means you’re actually engaging with the material, not just skimming the surface.
얼마 전 위스키 입문하는 친구한테 연락이 왔어요. “야, 싱글몰트 하나 사고 싶은데 10만 원 안쪽으로 뭐가 좋아?” 그래서 제가 되물었죠. “너 지금 어디서 사려고?” 답이 없더니 유명 편의점 위스키 옆에서 찍은 사진을 보내왔어요. 글렌피딕 12년 옆에 발베니, 그 옆에 처음 보는 브랜드까지. 병 디자인만 보고 고르려 하더라고요.
솔직히 말할게요. 2026년 기준으로 싱글몰트 시장은 ‘가성비’의 기준 자체가 달라졌어요. 환율 영향으로 수입 위스키 가격이 전반적으로 올랐고, 예전에 ‘가성비 끝판왕’이라 불리던 제품들이 슬그머니 가격을 올렸거든요. 그 와중에 진짜 숨겨진 픽들이 있어요. 오늘은 제가 직접 마셔보고, 비교하고, 돈 아깝다 싶었던 것들 걸러낸 다음 남은 Top 3만 얘기해드릴게요.
🥃 2026년 싱글몰트 가성비 판도가 바뀐 이유
🏆 Top 3 선정 기준 — 가격, 풍미, 구하기 쉬운 정도
🥇 1위: 글렌모렌지 오리지널 10년 — 지금 이 가격에 이 품질?
🥈 2위: 아벨라워 12년 더블캐스크 — 숨겨진 진짜 가성비
🥉 3위: 글렌알라키 12년 — 입문자도, 고수도 납득하는 그 맛
📊 한눈에 비교하는 스펙 & 가격 테이블
❌ 싱글몰트 고를 때 절대 하지 말아야 할 실수
❓ FAQ — 자주 물어보는 것들
2026년 싱글몰트 가성비 판도, 왜 달라졌나
2026년 현재 원/달러 환율이 1,350원~1,400원대를 유지하면서 수입 위스키 병당 원가가 2년 전 대비 평균 8~12% 올랐어요. 특히 글렌피딕 12년은 마트 기준 55,000원~62,000원, 발베니 12년 더블우드는 85,000원~95,000원대를 형성하고 있는 상황. 예전 같으면 발베니가 압도적 가성비였는데, 지금은 “그 돈 주면 다른 거 사지”라는 말이 나올 정도예요.
반면에 이 글에서 소개할 3종은 아직까지 가격 방어가 잘 되고 있고, 실제 테이스팅 퀄리티 대비 가격이 유독 유리한 구간에 있어요. 단순히 “싸다”가 아니라 “이 가격에 이 맛이?”라는 반응이 나오는 제품들이에요.
Top 3 선정 기준
제가 기준을 세 가지로 잡았어요.
가격대: 2026년 기준 국내 구매가 6만 원~12만 원 이내 (편의점·마트·면세점 모두 고려)
풍미 완성도: Nose / Palate / Finish가 밸런스 있게 잡혀 있을 것. 어느 하나가 너무 튀거나 밋밋하지 않을 것
구매 접근성: 마트·편의점·온라인에서 쉽게 구할 수 있을 것. 구하러 뛰어다니는 건 이미 가성비가 아님
🥇 1위: 글렌모렌지 오리지널 10년 (Glenmorangie Original 10Y)
2026년 현재 마트 기준 62,000원~72,000원. 면세점에서는 35달러 내외. 하이랜드 스타일의 교과서 같은 위스키인데, 이 가격대에서 이 완성도를 보여주는 제품이 사실 많지 않아요.
Nose (향): 첫 향부터 복숭아, 살구 같은 밝고 가벼운 과실향이 올라와요. 거기에 은은한 바닐라와 오렌지 제스트가 겹치는데, 전혀 무겁지 않아요. 알코올 자극이 적고 향이 부드럽게 열리는 편이라 위스키 처음 접하는 분들도 거부감 없이 맡을 수 있어요.
Palate (맛): 입에 넣으면 꽤 크리미해요. 바닐라 크림, 복숭아 잼, 살짝 꿀 느낌. 알코올 도수 43%인데 자극이 생각보다 적어요. 탄산 안 들어간 생수 한 방울 떨어뜨리면 꽃향기가 더 살아나요.
Finish (여운): 중간 길이의 피니시. 오크 타닌이 살짝 올라오면서 달달한 과실의 잔향이 10~15초 정도 남아요. 너무 짧지도 않고, 부담스럽게 길지도 않아서 식사 후 디저트 위스키로 딱 좋아요.
현재 스코틀랜드 탈로시 증류소에서 내놓는 표준 라인업인데, 18m 짜리 구리 증류기(업계 최장 중 하나)에서 증류된다는 게 이 가벼운 풍미의 비결이에요. 공식 사이트(glenmorangie.com)에서도 “가장 많이 팔리는 표현”으로 소개하고 있고요.
🥈 2위: 아벨라워 12년 더블캐스크 (Aberlour 12Y Double Cask)
2026년 현재 마트·편의점 기준 75,000원~88,000원. 처음 이 가격 보면 “비싼 거 아냐?” 싶은데, 마셔보면 생각이 바뀌어요. 스페이사이드 위스키인데 아메리칸 오크 + 셰리 캐스크 더블 숙성이라 풍미 레이어가 예상보다 훨씬 복잡해요.
Nose (향): 오렌지 마멀레이드, 건포도, 다크 초콜릿 힌트. 셰리 영향이 확실히 느껴지는데 과하지 않아요. 베이킹한 사과 같은 따뜻한 스파이스 노트도 살짝 받쳐줘요.
Palate (맛): 중간 바디감. 달콤한 토피, 크랜베리, 오크 스파이스가 순서대로 지나가요. 피트 없이도 꽤 깊은 느낌을 주는 게 장점이에요. 물 없이 스트레이트로 마셨을 때 알코올 자극이 43% 치고는 제법 있는 편이에요. 아이스 큐브 하나 넣거나 물 2~3방울 추천해요.
Finish (여운): 긴 편이에요. 셰리 캐스크 특유의 건과일 잔향이 20초 이상 남아요. 입 안이 따뜻해지면서 시나몬 노트가 마지막에 올라오는 게 포인트.
아벨라워는 국내 인지도가 글렌피딕이나 맥캘란보다 낮아서 상대적으로 저평가된 구간에 있어요. 샴페인 지방 명가인 페르노 리카르 산하 브랜드인데, 셰리 캐스크 비율이 높아서 스위트 앤 스파이시 조합 좋아하는 분한테는 진짜 강추예요.
🥉 3위: 글렌알라키 12년 (GlenAllachie 12Y)
2026년 현재 온라인·백화점 기준 95,000원~115,000원. “10만 원 넘는데 가성비냐”고 물을 수 있는데, 이 제품은 가격 대비 품질 체감이 그냥 달라요. 2017년에 빌리 워커(Ballantine’s, BenRiach 전 마스터 블렌더)가 인수한 이후로 품질이 급격히 올라간 증류소예요.
Nose (향): 진한 셰리 표현. 블랙커런트, 자두, 다크 초콜릿이 묵직하게 깔리고, 그 위에 오렌지 껍질과 약간의 오크 타닌이 올라와요. 처음 잔에 따르자마자 향부터 압도적이에요.
Palate (맛): 풀 바디. 리치, 체리, 에스프레소, 생강 스파이스까지 레이어가 정말 많아요. 46% 논-칠필터드(Non Chill-Filtered)라 오일리한 텍스처가 그대로 살아있어요. 이게 10만 원대 위스키 맞나 싶을 정도.
Finish (여운): 굉장히 길고 따뜻한 피니시. 셰리 잔향과 오크 스파이스가 30초 이상 지속돼요. 니트(neat)로 마셨을 때 진가가 드러나는 타입이에요.
글렌알라키를 아직 모르는 분들이 많은데, 위스키 커뮤니티(reddit.com/r/whisky, 네이버 위스키 갤러리)에서 “가성비 셰리몬스터” 타이틀로 꾸준히 언급되고 있어요. 맥캘란 12년 더블캐스크(12만~14만 원대)와 직접 비교해도 풀리지 않는 분들이 많을 정도예요.
📊 2026년 가성비 싱글몰트 Top3 비교표
항목
글렌모렌지 오리지널 10Y
아벨라워 12Y 더블캐스크
글렌알라키 12Y
국내 구매가 (2026 기준)
62,000~72,000원
75,000~88,000원
95,000~115,000원
도수
43%
43%
46%
숙성 방식
버번 오크
아메리칸+셰리 더블캐스크
셰리+포트+버번 멀티캐스크
Nose
복숭아, 바닐라, 오렌지
마멀레이드, 건포도, 초콜릿
자두, 블랙커런트, 다크초콜릿
Palate
크리미, 꿀, 살구
토피, 크랜베리, 스파이스
리치, 체리, 에스프레소
Finish 길이
중간 (10~15초)
길다 (20초 이상)
매우 길다 (30초 이상)
바디감
라이트~미디엄
미디엄
미디엄~풀
구매 접근성
⭐⭐⭐⭐⭐ (편의점 가능)
⭐⭐⭐⭐ (대형마트)
⭐⭐⭐ (백화점·온라인)
입문자 추천도
⭐⭐⭐⭐⭐
⭐⭐⭐⭐
⭐⭐⭐
셰리 스타일 선호자
❌ 아니오
⭕ 예
⭕⭕ 강력 예
한 줄 평
입문자 교과서
숨겨진 퍼포머
가성비 셰리몬스터
❌ 싱글몰트 고를 때 절대 하지 말아야 할 실수
병 디자인만 보고 사기: 예쁜 병=좋은 위스키라는 공식은 없어요. 패키지 마케팅 비용이 위스키 원액 품질로 이어지지 않아요. 특히 기프트 패키징 제품은 동일 원액인데 2~3만 원 비싼 경우가 많아요.
나이(연수)만 보고 고르기: 12년 > 10년이라는 공식 없어요. 증류소 스타일, 캐스크 선택, 마스터 디스틸러 역량이 훨씬 중요해요. 글렌모렌지 10년이 일부 15년짜리보다 맛있다는 평가가 공공연하게 있어요.
면세점 = 무조건 최저가 착각: 2026년 현재 국내 면세 한도(주류 기준 1L 이하, 400달러 이내)를 초과하면 세금이 붙어서 마트보다 비싸지는 경우가 생겨요. 특히 면세점 독점 패키지는 꼭 환산 가격 계산하고 사세요.
온더록스로 무조건 마시기: 얼음이 향을 죽여요. 특히 아벨라워, 글렌알라키처럼 향이 복잡한 제품은 물 2~3방울이나 니트로 먼저 맛보고 나서 취향에 맞게 조절하는 게 맞아요.
인플루언서 추천만 믿고 대량 구매: 위스키는 개인 팔레트 차이가 크게 나요. 무조건 1병 사서 마셔보고 맞으면 그다음에 더 사는 게 정답이에요.
보관을 소홀히 하기: 직사광선 + 세워두기 + 25도 이상 보관하면 향이 변해요. 눕혀서 보관하면 코르크가 위스키에 닿아 이취가 생길 수 있으니 반드시 세워서 서늘한 곳에 보관하세요.
❓ FAQ
Q1. 세 개 중에 위스키 완전 처음이면 뭐 사야 해요?
무조건 글렌모렌지 오리지널 10년 사세요. 향이 부드럽고 과실향 위주라 거부감이 가장 적어요. 피트 없고, 셰리 묵직함도 없고, 그냥 “아, 이게 스카치 싱글몰트구나” 하는 교과서 같은 맛이에요. 여기서 입맛 잡고 나서 셰리 스타일 가고 싶으면 아벨라워, 더 강하고 복잡한 거 원하면 글렌알라키로 가면 돼요.
Q2. 맥캘란 12년이랑 글렌알라키 12년이랑 진짜로 비교가 돼요?
블라인드 테이스팅 기준으로는 충분히 경쟁해요. 맥캘란 12년 더블캐스크(현재 국내가 130,000원~145,000원)와 글렌알라키 12년(95,000원~115,000원)을 나란히 놓고 마셔보면, 셰리 표현력은 글렌알라키가 밀리지 않아요. 물론 맥캘란 특유의 실키한 텍스처는 다른 개성이지만, 돈 대비 체감으로는 글렌알라키가 유리한 구간이 맞아요.
Q3. 아벨라워 12년이 아니라 A’bunadh 사야 하는 거 아닌가요?
A’bunadh(아부나흐)는 캐스크 스트렝스(60%대)라 맥락이 달라요. 가격도 2026년 현재 140,000원~160,000원대로 올랐고, 알코올 도수 때문에 물 희석이 필수예요. 아부나흐의 강렬함을 원하는 분한테는 맞지만, “가성비 싱글몰트 일상 음용”이라는 이 글의 맥락에서는 12년 더블캐스크가 훨씬 현실적이에요. 아부나흐는 나중에 셰리 캐스크 욕심 생겼을 때 도전하는 식으로 단계를 밟는 걸 추천해요.
결론 — 한 줄 평과 엣지 있는 마무리
2026년 기준 싱글몰트 가성비 게임은 “유명 브랜드 프리미엄을 얼마나 피하느냐”예요. 글렌피딕이나 발베니 같은 브랜드를 무시하는 게 아니라, 그 브랜드들이 이미 마케팅 비용이 가격에 충분히 반영됐다는 얘기예요.
오늘 소개한 세 개는 그 가격대 안에서 풍미 밀도가 유독 높고, 2026년 현재 아직 ‘가격이 덜 붙은’ 스위트 스폿에 있어요. 이 중 하나라도 이미 마셔봤다면 댓글로 알려주세요. 입문자 vs 고수 반응이 어떻게 갈리는지 꽤 흥미롭거든요.
작년에 지인이 전화 한 통 했어요. “형, 나 ESS 설치했는데 전기세가 오히려 더 나왔어.” 순간 할 말을 잃었습니다. 알고 보니 배터리 용량 계산 없이 영업사원 말만 믿고 계약했던 거예요. 설치비만 1,400만 원. 회수 기간을 물어봤더니 “18년이요”라고 하더라고요. 태양광 발전량이 애초에 부족한 남향이 아닌 동향 지붕에 설치한 것도 문제였죠.
이 글은 그 지인 때문에 시작됐습니다. 저도 직접 3군데 설치 업체 견적을 받아보고, 한국에너지공단 데이터를 파고, 실제 설치 가구 커뮤니티를 6개월째 모니터링한 결과물이에요. 2026년 기준 ESS 설치를 고민 중이라면, 계약서에 도장 찍기 전에 이 글 한 번만 읽어보세요.
📊 2026년 ESS 설치 비용 현실 — 견적서에 숨겨진 숫자
⚡ 내 집에 몇 kWh가 필요한지 계산하는 법
🔋 ESS 배터리 종류 비교 — LFP vs NMC, 뭘 골라야 하나
🏠 설치 전 꼭 확인해야 할 지붕 조건 체크리스트
💰 보조금 & 세액공제 — 2026년 달라진 것들
🚫 절대로 하지 말아야 할 실수 5가지
❓ FAQ — 실제로 가장 많이 물어보는 것들
📊 2026년 ESS 설치 비용 현실 — 견적서에 숨겨진 숫자
태양광+ESS 패키지 설치 비용은 시스템 용량에 따라 천차만별입니다. 2026년 현재 국내 평균 설치 단가를 정리하면 이렇습니다.
시스템 구성
설치 용량
설치비 (보조금 전)
보조금 적용 후
예상 회수 기간
태양광 단독
3kW
약 500~600만 원
약 300~400만 원
7~9년
태양광 + ESS (소형)
3kW + 5kWh
약 1,100~1,300만 원
약 750~950만 원
12~15년
태양광 + ESS (중형)
5kW + 10kWh
약 1,800~2,200만 원
약 1,200~1,600만 원
14~18년
태양광 + ESS (대형)
8kW + 15kWh
약 2,800~3,500만 원
약 2,000~2,500만 원
16~20년
솔직히 말할게요. ESS 단독으로 투자 회수를 기대하고 설치하면 십중팔구 실망합니다. 현재 전기 요금 구조에서 kWh당 절감 단가는 약 120~180원 수준인데, 배터리 10kWh를 완충/완방 사이클로 매일 돌린다 해도 하루 1,200~1,800원, 월 36,000~54,000원 절감이 최대예요. 설치비 회수에 수십 년이 걸리는 구조입니다.
그렇다면 왜 설치하냐고요? 정전 대비, 에너지 자립 만족감, 향후 전기차 충전 인프라 선점이 주된 이유입니다. 이 세 가지에 가치를 두는 분이라면 충분히 의미 있는 투자가 될 수 있어요.
⚡ 내 집에 몇 kWh가 필요한지 계산하는 법
영업사원이 제일 싫어하는 질문이 “왜 이 용량이어야 하나요?”입니다. 직접 계산해보면 의외로 간단해요.
Step 1. 월 전기 사용량 확인 한전 홈페이지 또는 스마트한전 앱에서 최근 12개월 사용량 평균을 확인하세요. 일반 4인 가구 기준 월 350~450kWh 사용이 보통입니다.
Step 2. 하루 평균 사용량 계산 월 400kWh ÷ 30일 = 하루 약 13.3kWh
Step 3. 야간 사용 비중 파악 태양광 발전은 낮에만 이루어집니다. 야간(오후 6시~오전 8시)에 전체의 약 40~50%가 소비된다고 보면, 하루 5~7kWh가 ESS에서 공급되어야 하는 양입니다.
Step 4. 배터리 용량 선정 배터리는 80% DoD(방전 깊이)를 기준으로 운용합니다. 하루 6kWh가 필요하다면, 6 ÷ 0.8 = 7.5kWh 이상의 배터리가 필요하다는 뜻이에요. 실제로는 10kWh 배터리를 추천하는데, 흐린 날이나 계절적 발전량 감소를 감안해야 하기 때문입니다.
🔋 ESS 배터리 종류 비교 — LFP vs NMC
배터리 셀 종류에 따라 안전성, 수명, 가격이 크게 달라집니다. 2026년 현재 주거용 ESS에서 가장 많이 쓰이는 두 가지를 비교합니다.
항목
LFP (리튬인산철)
NMC (삼원계)
에너지 밀도
낮음 (부피 큼)
높음 (부피 작음)
사이클 수명
3,000~6,000 사이클
1,500~3,000 사이클
열폭주 위험
매우 낮음 ✅
상대적으로 높음 ⚠️
저온 성능
취약 (-10℃ 이하 급감)
상대적으로 양호
가격 (10kWh 기준)
약 350~500만 원
약 400~600만 원
추천 환경
실내/창고 설치, 장기 운용
공간 제약 환경
결론은 주거용이라면 LFP를 강력 추천합니다. 화재 위험이 낮고, 수명이 길어서 10년 이상 운용 시 배터리 교체 비용을 크게 줄일 수 있어요. NMC는 공간이 정말 좁거나, 고용량을 작게 설치해야 할 때 고려하세요. 단, LFP는 한국 겨울철 영하 날씨에 성능이 떨어지므로 배터리 설치 위치는 반드시 실내 혹은 단열된 공간이어야 합니다.
🏠 설치 전 꼭 확인해야 할 지붕 조건
태양광 패널 설치 가능 여부는 지붕 상태에서 판가름 납니다. 업체에서는 일단 설치 가능하다고 말하는 경우가 많으니, 본인이 먼저 체크하세요.
지붕 경사: 15~30° 경사가 최적. 평지붕은 별도 경사 구조물 필요 (추가 비용 발생).
지붕 하중: 패널 1kW당 약 15~20kg 추가 하중. 노후 주택은 구조 진단 필수.
그늘 여부: 오전 9시~오후 3시 사이 인근 건물, 나무 그림자가 닿으면 발전량 급감. 패널 1장만 가려도 직렬 연결 시 전체 출력 저하.
지붕 마감재: 기와 지붕은 설치비 추가 발생. 슬레이트 지붕은 석면 함유 가능성 확인 후 작업.
💰 2026년 보조금 & 세액공제 — 달라진 것들
2026년 현재 주거용 태양광 보조금은 지자체별로 편차가 크지만, 기본 골격을 정리하면 이렇습니다.
구분
지원 내용
지원 한도
신청처
한국에너지공단 (정부)
설치비 일부 보조
용량별 상이 (3kW 기준 약 90~120만 원)
그린홈 100만호 보급사업
지자체 추가 보조
지역별 추가 지원
20~100만 원 (지역별 상이)
각 시·군·구청
농촌/전원주택
농촌형 태양광 사업
최대 200만 원
농업기술센터
ESS 연계 추가 지원
ESS 추가 보조금
kWh당 10~15만 원 (한도 50kWh)
에너지공단
중요한 포인트: 보조금은 선착순 마감됩니다. 매년 상반기 예산이 빠르게 소진되니, 설치를 결심했다면 1~2월 중에 신청하는 게 유리해요. 또한 보조금 수령 후 5년 이내 시스템을 철거하거나 양도하면 보조금을 반납해야 하는 조항이 있으니 계약서를 꼼꼼히 읽으세요.
🚫 절대로 하지 말아야 할 실수 5가지
❌ 1개 업체 견적만 받기: 반드시 3곳 이상 비교하세요. 같은 용량도 업체별로 200~400만 원 차이 납니다. 한국에너지공단 ‘태양광 설치업체 조회’ 기능을 이용해 공단 등록 업체인지 확인하세요.
❌ 발전량 최대치만 믿기: 업체가 제시하는 발전량은 최적 조건 기준입니다. 실제 발전량은 20~30% 낮게 잡는 게 현실적이에요. 황사, 장마, 겨울철 적설을 고려하세요.
❌ 인버터 품질 무시하기: 패널만 좋은 걸 써도 인버터가 저가품이면 전체 효율이 떨어집니다. SMA, Fronius, Huawei FusionSolar, Growatt 등 검증된 브랜드를 요구하세요.
❌ A/S 조건 미확인: 패널 보증 25년, 인버터 보증 5~10년이 업계 기준입니다. 보증 기간이 짧거나 ‘시공사 보증’만 있는 경우 제조사 직접 보증 여부를 반드시 확인하세요. 시공사가 폐업하면 보증도 사라집니다.
❌ ESS 없이 태양광만 설치 후 나중에 ESS 추가: 나중에 ESS를 추가하면 인버터 교체 비용이 추가로 발생합니다. 처음부터 ESS 연계를 고려한 하이브리드 인버터를 설치하는 게 훨씬 경제적이에요.
❓ FAQ
Q1. 아파트에 사는데 태양광 ESS 설치가 가능한가요?
현실적으로 어렵습니다. 아파트 베란다에 소형 패널을 설치하는 ‘베란다 태양광’은 가능하지만 용량이 300~500W 수준이라 ESS와 연계하기엔 발전량이 너무 부족해요. 게다가 공동주택은 관리규약상 구조물 설치에 동호수 동의가 필요한 경우가 많습니다. ESS 투자를 생각하고 있다면 단독주택이나 전원주택 이사 시점을 함께 고려해보세요.
Q2. 10년 뒤 배터리를 교체해야 한다면 비용이 얼마나 드나요?
2026년 현재 LFP 배터리 10kWh 교체 비용은 약 200~300만 원 선입니다. 10년 전에 비해 배터리 단가가 크게 떨어진 상황이고, 기술 발전 속도를 감안하면 10년 후에는 더 낮아질 가능성이 높아요. 단, 인버터는 통상 10~12년 수명이기 때문에 배터리 교체 시점에 인버터도 함께 점검해야 합니다. 이 비용(약 80~150만 원)도 TCO(총소유비용)에 포함해서 계산하세요.
Q3. ESS 설치 후 전기차 충전도 연계할 수 있나요?
네, 가능합니다. 단, 인버터가 차량 충전 연계 기능을 지원해야 하고, 전기차 완속 충전기(7kW 기준)를 ESS에서 충당하려면 배터리 용량이 최소 10kWh 이상이어야 해요. 현실적으로는 낮 시간 태양광으로 차량을 직접 충전하고, ESS는 야간 가정용 전력 공급에 집중하는 구조가 가장 효율적입니다. Tesla Powerwall, Huawei LUNA, 삼성SDI SBB 등은 EV 충전 연계 기능을 공식 지원합니다.
📝 결론 — 한 줄 평
태양광 ESS는 “전기세 절약 투자”가 아니라 “에너지 자립 + 미래 인프라 투자”로 접근해야 손해를 안 봅니다. 10년 회수 계산만 들이밀면 숫자가 잘 안 맞아요. 대신 전기차 시대, 요금 인상 리스크 헤지, 정전 대비 가치를 함께 계산하면 이야기가 달라집니다. 지붕 조건 좋고, 보조금 받을 수 있고, 10년 이상 거주 계획이 있다면 — 지금이 딱 타이밍입니다. 조건이 하나라도 안 맞으면, 서두르지 마세요.
태양광 한 줄 평: 조건 맞으면 진짜 좋은데, 조건 안 맞으면 후회 1순위. 계약 전 이 글 다시 한 번 읽으세요.
A friend of mine — sharp guy, works in finance — told me last spring that he’d lost nearly 40% of his crypto portfolio in under three months. Not because of some rug pull or obscure altcoin. He was holding Bitcoin and Ethereum. “I did everything right,” he said, “and it still crushed me.” That conversation stuck with me, and it’s honestly why I started digging deeper into what separates people who survive crypto markets from those who don’t.
So let’s think through this together — not as a get-rich pitch, not as a doom warning, but as a real look at how cryptocurrency actually works in 2025 for someone trying to make informed decisions.
The Volatility Isn’t a Bug — But It Can Still Destroy You
Here’s the cold truth that most crypto content skips over: Bitcoin (BTC) has historically delivered annualized returns above 100% in bull years — but it also dropped 65% from its November 2021 peak to November 2022. Ethereum (ETH) dropped over 70% in the same window. If you entered at the wrong time without a risk plan, “holding a top asset” still meant catastrophic loss.
In 2025, the landscape has shifted somewhat. Bitcoin’s fourth halving occurred in April 2024, cutting block rewards from 6.25 BTC to 3.125 BTC. Historically, halvings have preceded major bull runs by 12–18 months — which puts the theoretical peak window squarely in 2025. But “historical pattern” is not a guarantee, and here’s the specific condition under which that thesis falls apart: if macroeconomic tightening returns (say, the Fed reverses course and raises rates again), risk assets including crypto tend to reprice downward regardless of supply mechanics.
BTC Ticker: Bitcoin — the reserve asset of crypto, most institutional adoption, highest liquidity
ETH Ticker: Ethereum — dominant smart contract platform, staking yield currently ~3.5–4.5% APY post-Merge
SOL Ticker: Solana — high-throughput competitor to ETH, but experienced 3 major network outages in 2022–2023; performance has stabilized in 2024–2025
BNB Ticker: Binance Coin — utility token tied directly to Binance exchange health, regulatory risk is real and concentrated
USDC / USDT: Stablecoins — not investments, but critical tools for parking capital during volatility without exiting to fiat
Where People Actually Lose Money (Specific Scenarios)
Let me be concrete here, because vague warnings don’t help anyone. These are the failure modes I’ve seen play out repeatedly:
Scenario 1 — Leverage liquidation: You open a 10x leveraged BTC long on Binance Futures at $60,000. A 10% price drop to $54,000 triggers liquidation and you lose your entire margin. This isn’t exotic — it happens daily. In Q1 2024, over $800 million in leveraged positions were liquidated in a single 24-hour period during a flash correction.
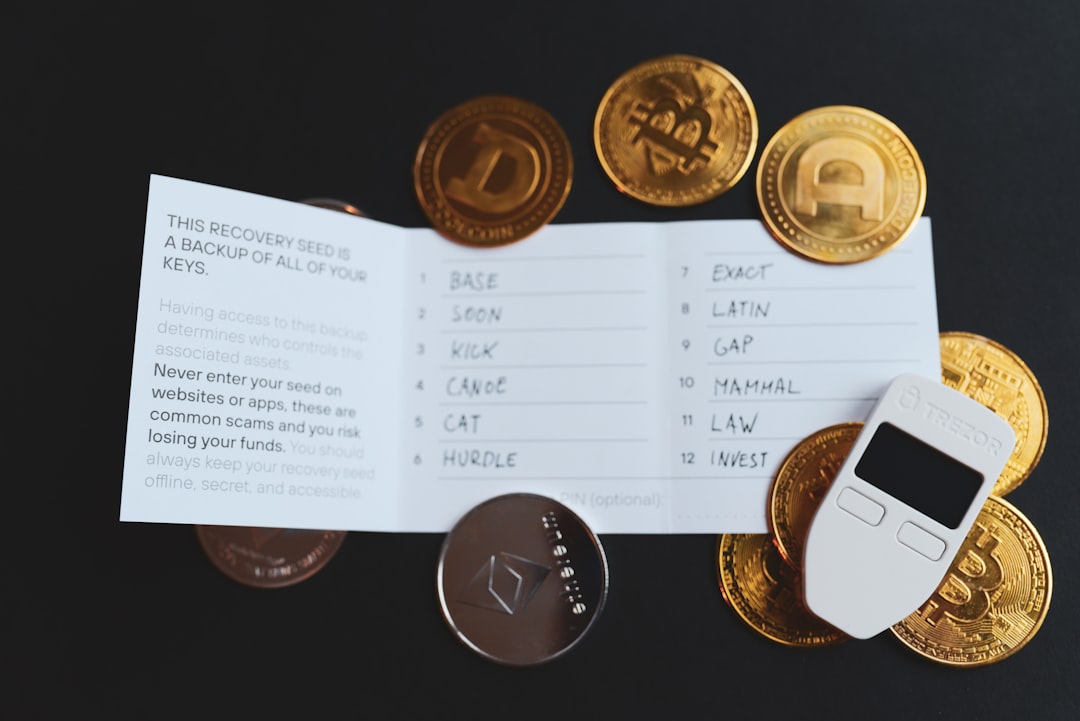
Scenario 2 — Exchange collapse: FTX held $8–10 billion in customer funds and collapsed in November 2022. If your crypto is on a centralized exchange, you do not control it. The fix is simple but requires action: move to self-custody using a hardware wallet (Ledger or Trezor). The rule in crypto circles is “not your keys, not your coins.”
Scenario 3 — Altcoin narrative traps: In every cycle, a wave of altcoins captures retail attention at or near peak prices. LUNA/UST erased $40+ billion in value in May 2022 in roughly 72 hours. The bullish scenario for altcoins is real — but so is the condition for total loss: projects with weak fundamentals, anonymous teams, or algorithmic stablecoin mechanics are extraordinarily high risk.
What the Data Says About Entry Strategy in 2025
Dollar-cost averaging (DCA) isn’t glamorous, but the evidence for it is hard to argue with. A Coin Metrics study found that any 4-year DCA period in Bitcoin’s history has been profitable — including entries made at the 2017 and 2021 peaks. The mechanism is simple: you buy a fixed dollar amount weekly or monthly regardless of price, which naturally averages down during corrections and removes the emotional burden of timing.
For someone starting in 2025, a reasonable framework used by institutional players like MicroStrategy (who holds 214,000+ BTC as of early 2025) and ARK Invest involves:
Allocating only what you can afford to have locked up for 3–5 years
Keeping 50–70% of any crypto allocation in BTC/ETH as base positions
Using stablecoins (USDC is preferred over USDT due to Coinbase/Circle’s audited reserves) to buy dips systematically
Never using borrowed money or leverage unless you genuinely understand liquidation mechanics
Hardware wallet storage for anything above $1,000 in holdings
Regulatory Context: What’s Actually Changed in 2025
The U.S. regulatory environment has shifted meaningfully. The SEC’s approval of spot Bitcoin ETFs in January 2024 (BlackRock’s IBIT, Fidelity’s FBTC, and others) brought institutional capital channels that didn’t exist before. By Q1 2025, Bitcoin ETF products had accumulated over $50 billion in AUM combined. This matters because it changes the liquidity profile and introduces a class of investor that doesn’t panic-sell the same way retail does.
In Europe, MiCA (Markets in Crypto-Assets regulation) came into full effect in 2024, creating clearer compliance frameworks for exchanges and token issuers. This reduces — but doesn’t eliminate — regulatory surprise risk for major assets like BTC and ETH. Smaller tokens, especially those structured as securities, remain in a grey zone.
Realistic Alternatives If Pure Crypto Feels Too Risky
If someone tells you “crypto is too volatile for me,” the answer isn’t necessarily “then avoid it entirely.” Consider these stepped approaches:
Bitcoin ETFs (IBIT, FBTC): Exposure to BTC price without self-custody risk, tradeable in a regular brokerage account
Crypto equity proxies: Coinbase (COIN), MicroStrategy (MSTR), or mining stocks like Riot Platforms (RIOT) give indirect exposure with traditional stock market protections
Stablecoin yield: Platforms like Coinbase offer 4–5% APY on USDC, which is closer to a high-yield savings account than a speculation play — though smart contract and platform risk still applies
ETH staking: Liquid staking via Lido (stETH) or directly through Coinbase generates ~3.5–4.5% yield on ETH holdings, rewarding long-term conviction without active trading
If your situation is: “I believe in the long-term thesis but can’t stomach 60% drawdowns” — then Bitcoin ETFs + small DCA into spot BTC/ETH is your path. If your situation is: “I want yield without heavy speculation” — stablecoin yield or ETH staking is more aligned. If your situation is: “I want to actively trade” — please paper trade for at least 3 months before using real capital, and set a hard rule that you never risk more than 2% of portfolio on a single leveraged trade.
📌 One last thought: My friend who lost 40%? He’s still in crypto. He restructured around DCA, moved to self-custody, and stopped checking prices daily. He’s not euphoric about it — but he’s not bleeding either. That mindset shift, from “how do I get rich fast” to “how do I not get wiped out while staying exposed to upside” — that’s the actual edge most people never develop. And honestly, it applies to every asset class, not just crypto.
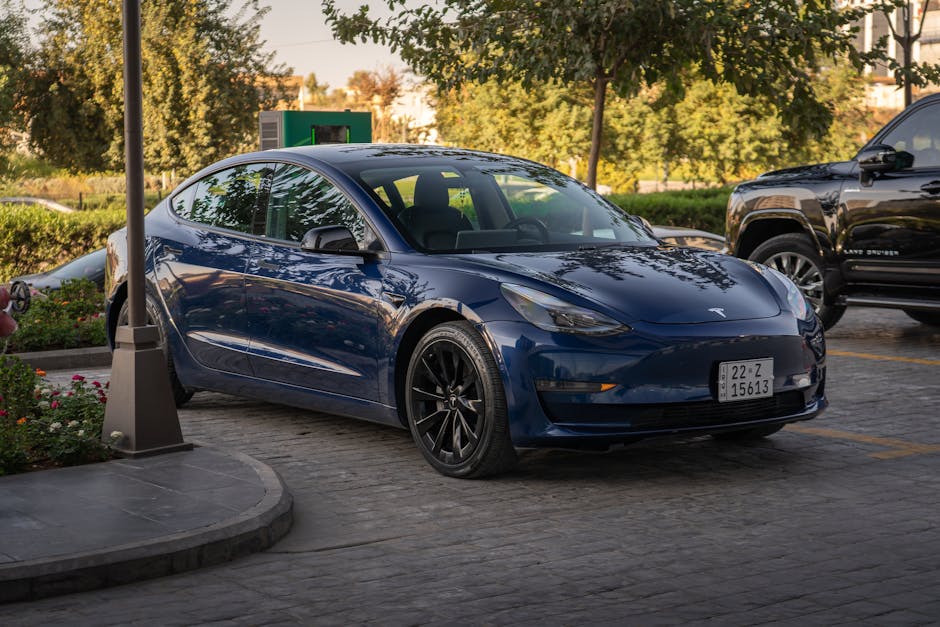
작년 말, 가까운 선배가 전화를 해왔어요. “야, 나 타이칸 샀는데 6개월 만에 팔았어.” 이유를 물었더니 한숨부터 나오더라고요. 충전 인프라 문제도, 주행거리 부족도 아니었어요. 진짜 이유는 ‘기대와 현실의 갭’이었습니다. 저도 직접 시승하고, 오너 커뮤니티 300개 이상의 후기를 분석하고, 실사용 데이터를 뜯어봤어요. 그래서 오늘은 포르쉐 타이칸을 사기 전에 반드시 알아야 할 것들을 아는 동생처럼 솔직하게 털어놓겠습니다.
🔋 실제 주행거리 — 공인 수치 믿다가 낭패 보는 이유
💸 총소유비용(TCO) 계산 — 기름값 아끼려다 더 쓰는 구조
⚡ 충전 인프라 현실 — 2026년에도 여전한 민낯
🔧 유지보수 & 고장 패턴 — 독일차 특유의 ‘전자계통 복불복’
📊 경쟁 모델 비교표 — 타이칸 vs EQS vs 아이오닉6 N
🚫 절대 하지 말아야 할 실수 — 구매 전 체크리스트
❓ FAQ — 오너들이 가장 많이 묻는 질문 3가지
🔋 실제 주행거리 — 공인 수치 믿다가 낭패 보는 이유
포르쉐 타이칸 4S(2026년형 기준) 공인 복합 주행거리는 약 531km(WLTP 기준)입니다. 들으면 꽤 괜찮죠? 그런데 실제 오너들 데이터는 달라요. 국내 주요 EV 커뮤니티(보배드림, 클리앙 EV 게시판)에서 수집된 실사용 평균은 여름 기준 410~440km, 겨울(영하 5도 이하) 기준 290~320km까지 떨어집니다.
왜 이렇게 차이가 날까요? 타이칸은 800V 아키텍처를 사용하는데, 이 고전압 시스템이 저온 환경에서 배터리 컨디셔닝(예열)에 에너지를 상당히 소모합니다. 실제로 히트펌프 옵션(약 190만 원 추가) 미장착 차량은 겨울철 배터리 효율이 최대 38% 이상 감소하는 사례가 보고됐어요. 히트펌프 옵션은 선택이 아니라 필수입니다.
스포츠 크로노 패키지를 활성화하고 런치 컨트롤을 자주 쓴다면? 실주행 거리는 250km 아래로도 내려갑니다. 포르쉐를 포르쉐답게 타면 전기차 장점이 반감된다는 아이러니가 생기는 거예요.
💸 총소유비용(TCO) 계산 — 기름값 아끼려다 더 쓰는 구조
많은 분들이 “전기차니까 유지비 싸겠지”라고 생각합니다. 타이칸은 그 공식이 통하지 않아요. 2026년 기준 국내 출시가를 기준으로 계산해봤습니다.
항목
포르쉐 타이칸 4S
메르세데스 EQS 450+
현대 아이오닉6 N (예상)
기본 출시가 (만원)
약 17,500
약 15,800
약 5,800
전기차 보조금 (국고+지자체, 서울 기준)
지원 없음 (가격 초과)
지원 없음 (가격 초과)
약 500~700만원
연간 전기료 (연 2만km 기준)
약 120만원
약 115만원
약 85만원
연간 보험료 (30대 남성 기준)
약 280만원
약 250만원
약 130만원
3년 감가 (잔존가치율)
약 55~60%
약 45~50%
약 60~65%
공식 서비스 비용 (연간)
약 80~150만원
약 70~120만원
약 40~70만원
3년 기준 타이칸 4S의 총소유비용은 차량 감가만으로 약 7,000만 원 이상이 녹습니다. 여기에 보험, 서비스, 충전 비용 합산하면 3년에 1억 원 가까운 비용이 나갑니다. “포르쉐는 감가가 잘 안 된다”는 말은 내연기관 모델 얘기예요. EV 라인업의 잔존가치는 시장에서 아직 검증 중입니다.
⚡ 충전 인프라 현실 — 2026년에도 여전한 민낯
타이칸의 최대 강점 중 하나가 800V 초고속 충전(최대 270kW)입니다. 이론적으로는 5~80%까지 약 22분이면 됩니다. 그런데 이걸 실현하려면 350kW급 이상 충전기가 필요해요.
2026년 현재 국내 공용 충전 인프라 중 350kW 이상 지원 기기는 전체의 약 8~12% 수준에 불과합니다(환경부 충전 인프라 통계 참고). 대부분의 공공 충전기는 50kW 또는 100kW급이에요. 이 경우 타이칸을 연결해도 실제 충전 속도는 최대 50~70kW로 쓰로틀링됩니다. 1억 7천짜리 차를 끌고 나와서 10만 원짜리 구형 충전기에 꽂는 아이러니.
자택 충전 환경이 없다면 더 심각해요. 아파트 거주자의 경우, 완속 충전기(7kW) 설치 자체가 관리사무소 승인 이슈로 막히는 경우가 여전히 많습니다. 타이칸은 반드시 자택 급속 충전기 설치 가능 환경을 전제로 구매해야 합니다.
🔧 유지보수 & 고장 패턴 — 독일차 특유의 ‘전자계통 복불복’
타이칸은 전기차임에도 불구하고 포르쉐 특유의 복잡한 전자 제어 시스템 탓에 소프트웨어 관련 이슈가 꾸준히 보고됩니다. 국내외 오너 포럼(Rennlist, 타이칸 오너스 클럽 코리아)을 모니터링한 결과, 빈번하게 언급되는 문제 유형은 다음과 같습니다.
PCM(포르쉐 통신 모듈) 소프트웨어 버그: 내비게이션 먹통, 무선 충전 패드 인식 불가 등 OTA 업데이트 후 일시적으로 발생. 재부팅으로 해결되는 경우가 많지만 서비스센터 방문이 필요한 경우도 있음.
열관리 시스템 경고등: 배터리 온도 센서 오류 관련 경고가 초기 물량 일부에서 보고됨. 공식 리콜은 아니지만 소프트웨어 패치 대상.
에어 서스펜션 이상: 장거리 주행 후 한쪽 에어스프링 에러 발생 사례. 부품 단가가 개당 150만~250만 원 수준이라 비용 부담이 큼.
포르쉐 공식 서비스센터 대기: 국내 포르쉐 공식 서비스센터는 2026년 현재 전국 약 20여 개소. 예약 후 입고까지 평균 2~3주 대기하는 경우도 있음.
📊 경쟁 모델 상세 비교 — 타이칸 vs EQS vs 아이오닉6 N
스펙 항목
포르쉐 타이칸 4S (2026)
메르세데스 EQS 450+
현대 아이오닉6 N
최고출력 (ps)
490 (오버부스트 시 530)
333
650 (예상)
0-100km/h (초)
4.0
6.2
3.4 (예상)
WLTP 주행거리 (km)
531
780
약 450 (예상)
배터리 용량 (kWh)
93.4
107.8
84 (예상)
최대 충전 속도 (kW)
270
200
350 (예상)
운전 집중도
스포츠 드라이빙 특화
럭셔리 크루징 특화
고성능 스포츠
실내 공간
협소 (스포츠카 포지셔닝)
최상급 (5인 풀 럭셔리)
세단 수준
추천 구매 대상
브랜드 & 드라이빙 경험 우선
승차감 & 장거리 우선
성능 대비 가격 우선
솔직히 말할게요. 장거리를 편하게 다니고 싶다면 EQS가 낫고, 성능 대비 가성비라면 아이오닉6 N이 훨씬 합리적입니다. 타이칸을 사야 하는 이유는 딱 하나 — “포르쉐를 타고 싶다”는 감성과 브랜드 경험 자체입니다. 이걸 부정하는 게 아니에요. 다만 그 대가를 정확히 알고 지불해야 한다는 거죠.
🚫 절대 하지 말아야 할 실수 — 구매 전 체크리스트
❌ 자택 충전 환경 미확인 상태로 계약: 아파트 충전기 설치 가능 여부를 관리사무소에 먼저 확인하세요. 안 되면 공용 충전기에 100% 의존해야 합니다.
❌ 히트펌프 옵션 없이 계약: 겨울철 주행거리 손실이 최대 38%입니다. 약 190만 원짜리 이 옵션은 선택이 아닙니다.
❌ 공인 주행거리만 보고 판단: WLTP 531km는 이상적 조건 수치입니다. 실제 겨울철 한국 도로에서는 300km 초반을 각오하세요.
❌ 감가 비용 무시: “포르쉐는 잘 안 떨어진다”는 건 내연기관 모델 얘기입니다. EV 라인업은 다릅니다.
❌ 스포츠 크로노 패키지만 믿고 일상 드라이빙 기대: 타이칸은 확실히 달리는 차입니다. 편안한 장거리 크루저를 원하신다면 다른 선택지를 보세요.
❌ 시승 없이 계약: 타이칸의 저중심 무게 배분과 스포티한 서스펜션 세팅은 호불호가 갈립니다. 장시간 시승은 필수입니다.
터보 S는 최고출력 761ps, 0-100km/h 2.8초로 수치가 압도적입니다. 하지만 출시가가 약 2억 6천만 원 이상으로 올라가고, 겨울철 실주행거리는 오히려 4S보다 더 떨어지는 경우도 있어요(고성능 모드 기본 활성화 탓). “더 빠른 차가 필요한가?”를 정말 진지하게 물어보세요. 대부분의 도로에서 4S도 이미 차고 넘칩니다.
Q2. 타이칸 크로스 투리스모가 낫지 않나요?
화물 적재 공간과 지상고가 필요하다면 크로스 투리스모가 실용적으로 낫습니다. 단, 공기역학 저하로 동일 배터리 기준 주행거리가 세단형 대비 약 20~30km 더 줄어듭니다. 가격도 약 1,000~1,500만 원 더 올라가고요. 아웃도어 라이프스타일이 실제라면 추천, 그냥 더 멋있어 보여서라면 재고해보세요.
Q3. 결국 타야 하나요, 말아야 하나요?
이렇게 대답할게요. 연간 주행거리 1만5천km 이하 + 자택 급속 충전 가능 + 포르쉐 브랜드에 감성적 가치를 느끼는 분 + 감가 비용을 ‘경험 비용’으로 흔쾌히 납득하는 분이라면 타이칸은 현존 최고의 드라이빙 머신 중 하나입니다. 반대로 “전기차니까 실용적이겠지”라고 생각하는 분께는 솔직히 비추입니다. 그 돈이면 다른 선택지가 너무 많거든요.
한 줄 평: 포르쉐 타이칸은 ‘최고의 전기차’가 아니라 ‘전기로 달리는 포르쉐’입니다. 그 차이를 이해하고 사는 분께는 정당한 선택이고, 모르고 사는 분께는 비싼 후회가 됩니다.
마지막으로 한마디 드리자면, 6개월 만에 판 선배가 후회한 건 차가 나빠서가 아니었어요. “내가 원하던 차가 맞는지”를 사기 전에 충분히 검토하지 않은 것에 대한 후회였습니다. 이 글이 그 검토를 대신해드렸으면 합니다.
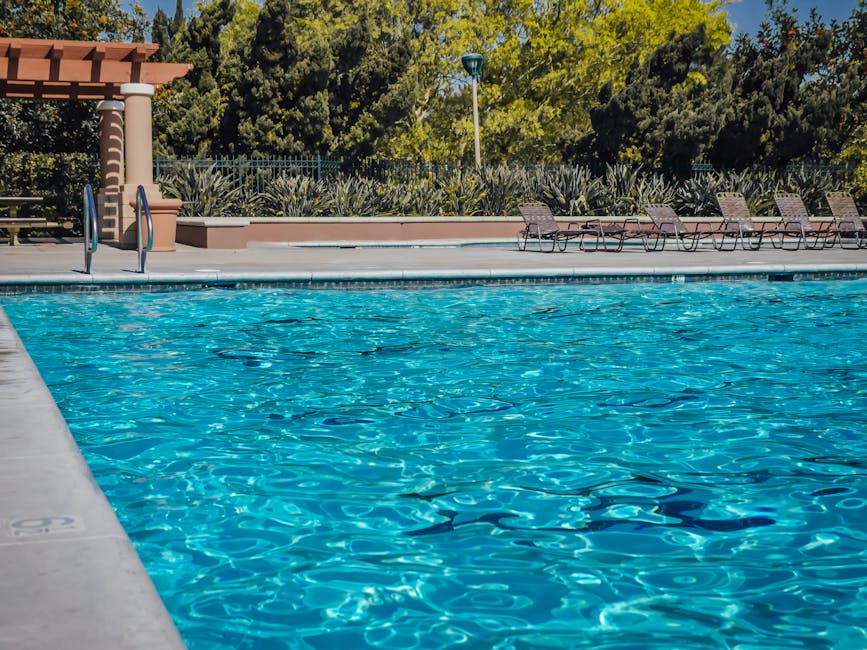
A neighbor of mine spent an entire summer fighting green, cloudy water in her backyard pool. She tried every quick-fix trick she found online — dumping in extra chlorine, scrubbing the walls daily, even draining half the pool and refilling it. By August, she was exhausted and seriously considering just filling the whole thing in with concrete. Sound familiar? Pool maintenance has a reputation for being this mysterious, expensive black hole that swallows weekends whole. But after digging into the chemistry, the equipment, and the actual root causes of most pool problems, I want to walk you through what’s really going on — and how to make it manageable.
Why Most Pool Problems Start with Chemistry, Not Equipment
Here’s the thing that trips up almost every pool owner: they treat the symptoms instead of the system. Cloudy water? Dump in clarifier. Green algae? Shock it with chlorine. And it works — temporarily. But two weeks later, the same problem is back.
The real culprit is usually pH imbalance or Total Alkalinity (TA) being out of range. Here’s a quick breakdown of the numbers you actually need to hit:
pH: 7.2 – 7.6 (below 7.2 = corrosive to equipment and skin; above 7.8 = chlorine becomes up to 90% less effective)
Total Alkalinity: 80 – 120 ppm (this is your pH’s buffer — get this right first)
Free Chlorine: 1 – 3 ppm for residential pools
Cyanuric Acid (CYA/Stabilizer): 30 – 50 ppm (without this, UV destroys your chlorine within hours)
Calcium Hardness: 200 – 400 ppm (too low = plaster erosion; too high = scale buildup)
Total Dissolved Solids (TDS): Under 2,000 ppm ideally
When my neighbor’s pool was analyzed properly, her pH was sitting at 8.1 and her CYA was near zero. No wonder the chlorine wasn’t doing anything — at pH 8.1, only about 10–15% of your chlorine is in the active hypochlorous acid form. She was essentially pouring money down a drain.
The Real Cost of Pool Ownership in 2025 (Nobody Talks About This)
Let’s get honest about money. A basic in-ground pool (approximately 15,000–20,000 gallons) will typically cost:
Monthly chemicals: $80–$150 depending on your region and whether you use a salt chlorine generator
Electricity (pump running 8 hrs/day): $50–$120/month (variable speed pumps can cut this by 50–70%)
Annual filter media replacement or cleaning: $30–$200
Professional opening/closing (seasonal climates): $200–$500 per service
Unexpected repairs (pump seals, O-rings, salt cell replacement): Budget $300–$800/year average
That’s a realistic $1,500–$3,000+ annually just to maintain a pool in good shape. If you’re in a frost climate and winterizing improperly, a single freeze crack in your plumbing can run $1,000–$5,000 in repairs. So the “set it and forget it” dream? It’s not real — but the workload is very manageable if you build a proper routine.
Salt Chlorine Generators vs. Traditional Chlorine: Which Actually Wins?
This debate comes up constantly, so let me break it down practically. Salt systems (like Hayward AquaRite, Pentair IntelliChlor, or Jandy TruClear) don’t eliminate chemistry — they just automate chlorine production by electrolyzing salt water. Your pool still has chlorine in it; it’s just being generated continuously in small amounts rather than added manually.
Pros of salt systems:
Softer-feeling water (lower chloramine buildup = less eye irritation)
More stable chlorine levels day-to-day
Lower long-term chemical cost after initial setup
Salt cell lifespan: typically 3–7 years depending on calcium scaling management
Cons nobody mentions upfront:
Salt cells need cleaning every 500 hours or they throw error codes (Hayward AquaRite commonly shows Inspect Cell or Check Salt warnings when calcium has built up)
Salt is corrosive over time to pool surroundings — concrete decking, metal fixtures, and nearby vegetation can suffer
Upfront cost: $600–$1,500 for the equipment, plus installation
If your CYA gets above 80 ppm, even a salt system struggles — this is called chlorine lock
My take: if you have a well-maintained pool with consistent use, a salt generator makes life noticeably easier. If you’re a seasonal user or dealing with an aging pool structure, stick with traditional trichlor tabs and shock — it’s cheaper and simpler to troubleshoot.
The Weekly Routine That Actually Works (Without Living at the Pool Store)
Here’s what a realistic, sustainable pool maintenance week looks like for a 15,000-gallon residential pool:
Monday (5 min): Test water with a reliable test kit — I recommend the Taylor K-2006 or the LaMotte ColorQ digital tester for accuracy. Avoid cheap test strips for anything beyond a quick visual check.
Tuesday (20 min): Adjust chemistry based on readings. Always adjust TA first, then pH, then chlorine — order matters.
Wednesday (10 min): Check and empty skimmer baskets; backwash sand filter if pressure gauge reads 8–10 psi above clean baseline.
Saturday (30–45 min): Brush walls and floor (algae clings to surfaces before it blooms visibly), vacuum or run robotic cleaner, skim surface debris.
Every 2–3 weeks: Shock the pool — even with a salt system. Use non-chlorine shock (potassium monopersulfate) for routine oxidation, or cal-hypo for algae treatment. Never add shock directly to skimmer with tabs in the basket — this combination can ignite.
Robotic Pool Cleaners in 2025: Worth It or Overpriced?
Robotic cleaners have come down significantly in price. Models like the Dolphin Nautilus CC Plus (around $600–$700) and the Polaris 9650iQ (around $900–$1,100) have genuinely changed weekend routines for pool owners. They operate independently of your filtration system, have their own internal filters, and scrub surfaces rather than just vacuuming loose debris.
If your situation is: you have pets or trees dropping heavy debris and you’re vacuuming manually twice a week — a robotic cleaner pays for itself in time savings within a single season. If your situation is: you have a small above-ground pool with light debris — a basic suction-side cleaner like the Hayward Aqua-Bug at $100–$150 is perfectly sufficient.
When to Call a Professional (And When It’s Just Overthinking)
Honestly, most pool chemistry issues are DIY-solvable. You don’t need a pool service company to balance your water weekly — that’s overkill for most homeowners. However, there are real situations where professional diagnosis saves you money in the long run:
Persistent algae that returns within 3–5 days of treatment (may indicate a phosphate problem or a dead spot in circulation)
Unexplained rapid chlorine loss (possible combined chlorine/chloramine issue requiring a breakpoint chlorination calculation)
Equipment making grinding, air-gurgling, or high-pitched sounds (cavitation in a pump is a repair-now situation, not a wait-and-see)
Visible cracks in plaster, tiles popping off, or leaking around returns — these escalate fast
The Association of Pool & Spa Professionals (APSP) and the Pool & Hot Tub Alliance (PHTA) both maintain certified technician directories if you need verified expertise in your area.
Alternative Routes: Above-Ground Pools, Plunge Pools, and Natural Pools
If all of this is making you rethink the traditional in-ground setup, that’s actually a healthy reaction. In 2025, there are genuinely compelling alternatives:
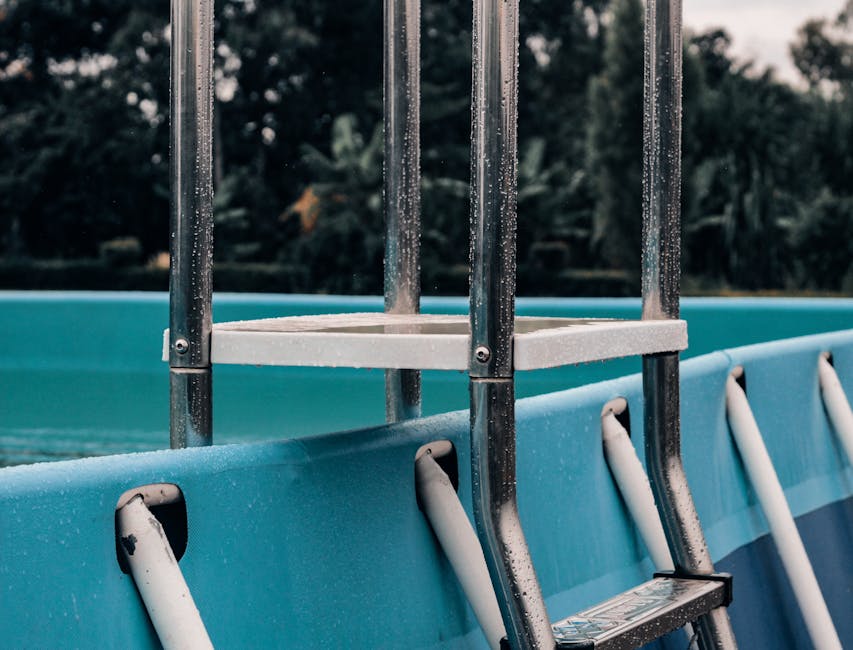
Above-ground pools (Intex, Bestway, Doughboy): $300–$5,000, dramatically lower maintenance volume, easy to drain and reconfigure
Plunge pools / spool (spa + pool hybrid): 10,000 gallons or under, faster heating, lower chemical use, increasingly popular in smaller urban yards
Natural swimming pools / biofiltered pools: No chemicals at all — uses aquatic plants and a regeneration zone to filter water. Popular in Europe (especially Germany and Austria), now gaining traction in the U.S. Higher upfront cost ($50,000+) but nearly zero chemical expense
Swim spas: Year-round use, compact footprint, $15,000–$30,000 range — great if lap swimming is the primary goal
Bottom line from someone who’s seen the full spectrum: Pool maintenance only feels overwhelming when you’re reacting to problems instead of preventing them. Get your chemistry dialed in first — test accurately, adjust in the right order, and be consistent about it. Everything else — the equipment, the cleaning routines, the salt vs. chlorine debate — is secondary to that foundation. Start with a good test kit, understand your five core numbers, and you’ll spend more time swimming than stressing.